![]()
This is one in a series of briefs prepared as part of C2ES’s Climate Innovation 2050 initiative, which brings together leading companies to examine potential pathways toward substantially decarbonizing the U.S. economy. Other briefs focus on Agriculture & Forestry, Buildings, Manufacturing, Power Generation, and Transportation. (Note: Full citations to supporting materials can be found in the pdf version of this brief.)
This brief provides an overview of emissions trends and projections, and of decarbonization challenges and opportunities, in the U.S. oil and natural gas sector. Key points include:
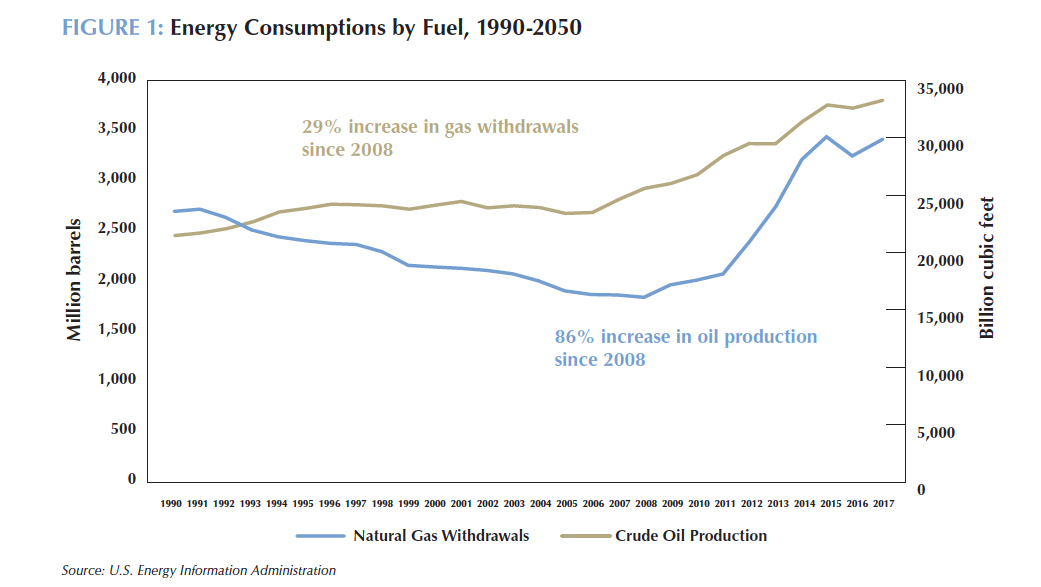
U.S. oil and gas production has grown significantly since 2008 with the rise in hydraulic fracturing and horizontal drilling from tight oil formations, often referred to as the “shale revolution.” Domestic oil and gas production has grown by 86 percent and 29 percent, respectively, since then (Figure 1). Increased production was also driven by a surge in oil prices to over $100 per barrel, until prices collapsed in 2014 and 2015. This surge of domestic production has affected both U.S. and global energy markets. Although the focus of this paper is the U.S. market, one must also consider aspects of the global market since it drives future investment in the domestic industry.
U.S. oil and gas production are expected to continue to rise in the coming decades, as a strong global economy continues to drive demand. The end of the U.S. ban on crude exports in 2015 has rapidly increased U.S. importance as a key global crude oil supplier. Likewise, the U.S. natural gas market had been limited by the pipeline network in North America, but recent investments in liquefied natural gas (LNG) export terminals will increase the U.S. role in global natural gas markets in coming years. In 2017, the United States became a net natural gas exporter, and by the early 2020’s, the country is projected to become a net energy exporter. U.S. production of crude oil is expected to be 26 percent higher in 2050 than in 2016. Natural gas is projected to grow the most on an absolute basis compared to all other fuel sources, with production forecast to be 60 percent higher in 2050.
Domestic demand for U.S. oil and gas products is driven by all sectors of the economy. In 2017, oil and gas accounted for 67 percent of total U.S. energy demand. Oil’s high energy density and relative ease to move makes it an ideal fuel for transportation; as such, oil filled 97 percent of energy demand in the transportation sector in 2017. The greatest demand for natural gas comes from the residential, commercial and industrial sectors. Natural gas accounted for 23, 18, and 26 percent of those sectors’ total energy needs, respectively.
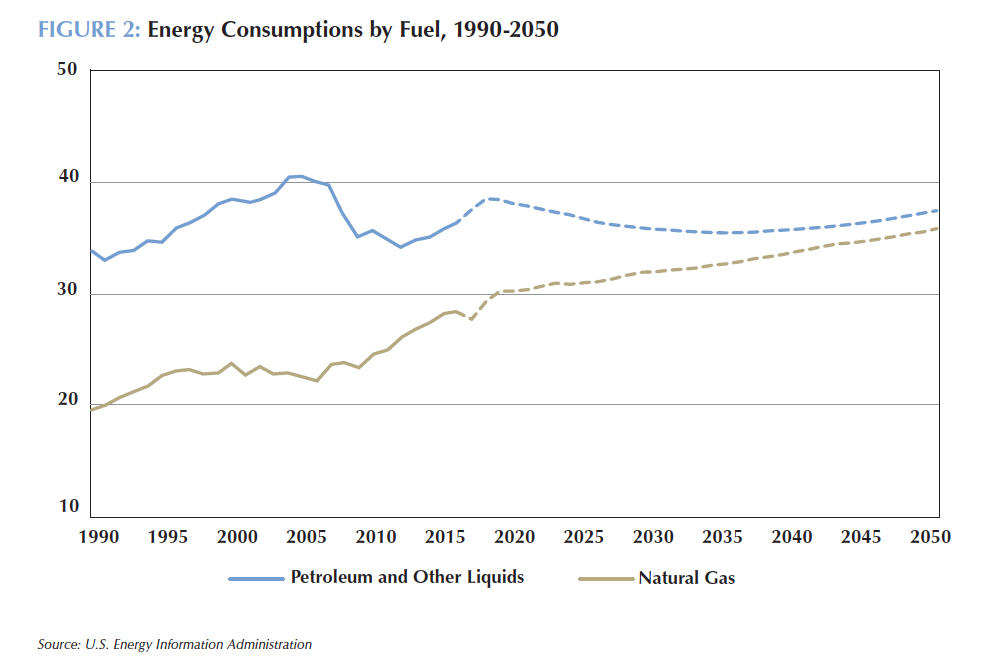
U.S. consumption of oil is expected to begin to flatten in the mid-2020’s out to 2050 as a result of increased vehicle fuel efficiency. However, demand growth for petroleum products is still expected in the industrial sector (Figure 2). Natural gas liquids (NGLs) are co-produced with oil and natural gas and are part of the same hydrocarbon family but composed exclusively of carbon and hydrogen. NGLs are used as petrochemical feedstock and in plastics, burned for space heating and cooking, and blended into vehicle fuel. Consumption of petrochemical feedstocks in the United States is forecast to double by 2050.
Natural gas consumption is also forecast to increase in the industrial sector for heat and power and for LNG production out to 2050. Growth is also expected in the power sector, particularly after renewable tax credits expire in the mid-2020s, albeit at a slower pace than in the industrial sector. Natural gas consumption in the residential and commercial sectors is expected to remain flat due to efficiency gains and demographics shifts that offset demand growth.
The combustion of natural gas and petroleum products accounted for 55 percent of U.S. greenhouse gas emissions in 2015. Emissions from natural gas consumption are expected to rise by nearly 30 percent in 2050 compared to 2017, while emissions from oil consumption are expected to decline by 8 percent.
Direct emissions from the oil and gas sector accounted for only 4 percent of total emissions. (As end-use emissions are covered in companion backgrounders on other sectors, the focus here is on the emissions directly related to the production, processing, and distribution of oil and gas products.)
Emissions from the oil and gas sector typically occur from equipment leaks, process venting, evaporation losses, disposal of waste gas streams (e.g., by venting or flaring), and accidents and equipment failures. More than 80 percent of the sectors’ emissions are associated with the leaking and venting of methane, a greenhouse gas much more potent than carbon dioxide (CO2). The oil and gas sector accounted for 25 percent of methane emissions in the United States in 2015.
Since natural gas is primarily made of methane, natural gas systems account for a larger share of methane emissions compared to oil systems. Valve leaks and emissions from gathering systems (pipelines that transport gas from the wellhead to a central collection point) account for 67 percent of methane emissions from the natural gas sector.
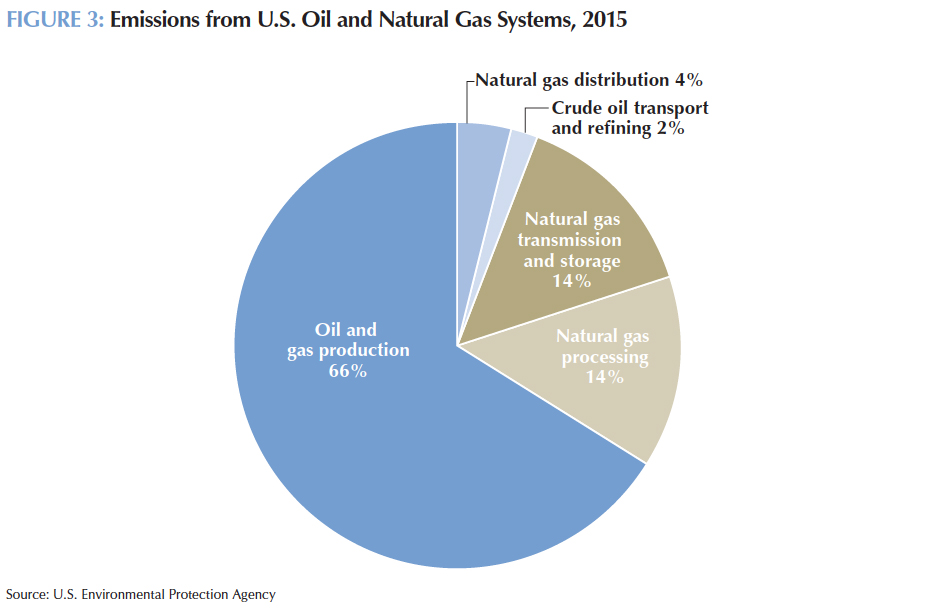
However, not all emissions are a result of methane leaks. For example, insufficient gathering lines at the wellhead could lead operators to flare natural gas rather than monetize it. Flaring results in fewer emissions than direct venting, since it turns the methane stream into CO2. This occurs more frequently in remote regions where natural gas is co-produced with oil and legacy gas pipeline infrastructure does not exist, such as the Bakken shale play in North Dakota. Figure 3 shows an overview of direct emissions from the oil and gas sector.
Now is a critical time for oil and gas producers to be thinking about the sector’s emission footprint. The recent abundance of low-cost U.S. natural gas supplies has led to increased consumption of natural gas, but a longer-term focus on the transition to a low-carbon energy system means that new investments in natural gas infrastructure are being scrutinized much more closely with regard to their life-cycle emissions.
Current estimates of life-cycle emissions vary widely. Most data are based on mathematical calculations using emissions factors rather than direct measurement, which is infeasible for such a complex and diffuse system. However, recent direct measurement studies indicate that most emissions come from “super-emitters,” a small number of sources that account for a disproportionate share of the sector’s emissions. According to a 2015 study in the Barnett shale, 2 percent of facilities accounted for 50 percent of methane emissions at any one time, with 10 percent of facilities responsible for 90 percent of emissions.
The oil and gas sector’s role in addressing long-term emissions is complicated by the projected continued rise of global energy demand; the International Energy Agency (IEA) projects global energy demand to be 30 percent higher in 2040 than today. The sector must balance meeting energy demand needs while also transitioning toward lower-carbon and more sustainable sources of energy.
The oil and gas sector has many opportunities to lower its GHG footprint, ranging from investing in emissions reductions technologies to working with other industries that may shape how demand for fossil fuels unfolds over the next several decades.
One of the most direct means of reducing the sector’s emissions is to invest in efficiency measures that reduce its operational footprint. Advances in digital technology could provide new opportunities for the sector to become more efficient. For example, better technology could lead to more accurate targeting of productive wells and result in fewer “dry holes,” which would reduce overall energy expended for oil and gas production activities. Another key opportunity to improve the efficiency of oil and gas operations is to reduce flaring and methane emissions, especially since methane is the largest contributor of the sector’s direct emissions. Methane is also a resource that can be monetized; therefore, the payback for reducing emissions makes abatement more economically feasible.
A long-term supply of low-cost natural gas will help to solidify natural gas’ role in the power sector, even as the cost of renewables declines. However, while coal-to-gas switching has helped to reduce power sector CO2 in recent years, by mid-century, CO2 emissions from gas-fired power plants will be sizable if abatement options are not developed. Developing CCUS options for natural gas combustion will be critical to maintaining natural gas’ role in the power sector fuel mix if the United States is to substantially decarbonize by mid-century.
Opportunities also exist in the transportation sector. Increased electrification of the transportation sector is expected to increase power demand and, as such, demand for natural gas in the power sector. In addition, use of natural gas instead of diesel may be an opportunity to reduce emissions in long-haul fleet vehicles, where electrification remains more challenging than in light-duty vehicles.
Lastly, increased use of NGLs as feedstock for plastics and other final products is another opportunity for the sector, as it does not result in combustion emissions.
U.S. Energy Information Administration, Annual Energy Outlook 2018, February 6, 2018. https://www.eia.gov/outlooks/aeo/.
U.S. Department of Energy, Natural Gas Liquids Primer, December 2017. https://www.energy.gov/fe/downloads/natural-gas-liquids-primer.
U.S. Environmental Protection Agency, Inventory of U.S. Greenhouse Gas Emissions and Sinks: 1990–2015, April 13, 2017. https://www.epa.gov/ghgemissions/inventory-us-greenhouse-gas-emissions-and-sinks-1990-2015.
Picard, David, “Fugitive Emissions from Oil and Natural Gas Activities,” Good Practice Guidance and Uncertainty Management in National Greenhouse Gas Inventories, May 2000. https://www.ipcc-nggip.iges.or.jp/public/gp/bgp/2_6_Fugitive_Emissions_from_Oil_and_Natural_Gas.pdf.
IPCC, Climate Change 2014: Synthesis Report, Contribution of Working Groups I, II and III to the of the Intergovernmental Panel on Climate Change, 2014. http://www.ipcc.ch/report/ar5/syr/.
Alvarez, et al., “Greater Focus Needed on Methane leakage from natural gas infrastructure,” Proceedings of the National Academy of Sciences, April 2012. https://www.ncbi.nlm.nih.gov/pmc/articles/PMC3340093/.
Zavala-Araiza, et al., “Reconciling divergent estimates of oil and gas methane emissions, Proceedings of the National Academy of Sciences, December 22, 2015. https://www.ncbi.nlm.nih.gov/pmc/articles/PMC4697433/.
International Energy Agency, World Energy Outlook 2017, 2017. https://www.iea.org/weo2017/.
ICF International, Economic Analysis of Methane Emission Reduction Potential from Natural Gas Systems, May 2016. http://onefuture.us/wp-content/uploads/2018/05/ONE-Future-MAC-Final-6-1.pdf.
IHS Energy, “Natural Gas in On Road Transportation,” Stanford Natural Gas Initiative, October 12, 2016. kdjsvoijvdiohttps://ngi.stanford.edu/sites/default/files/7_Groode_IHS.pdf.