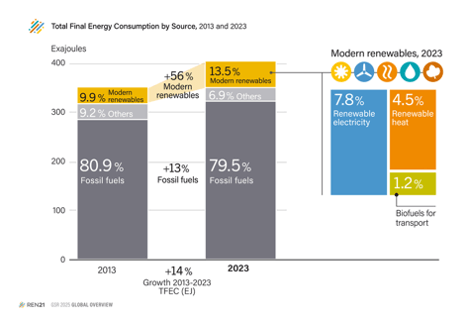
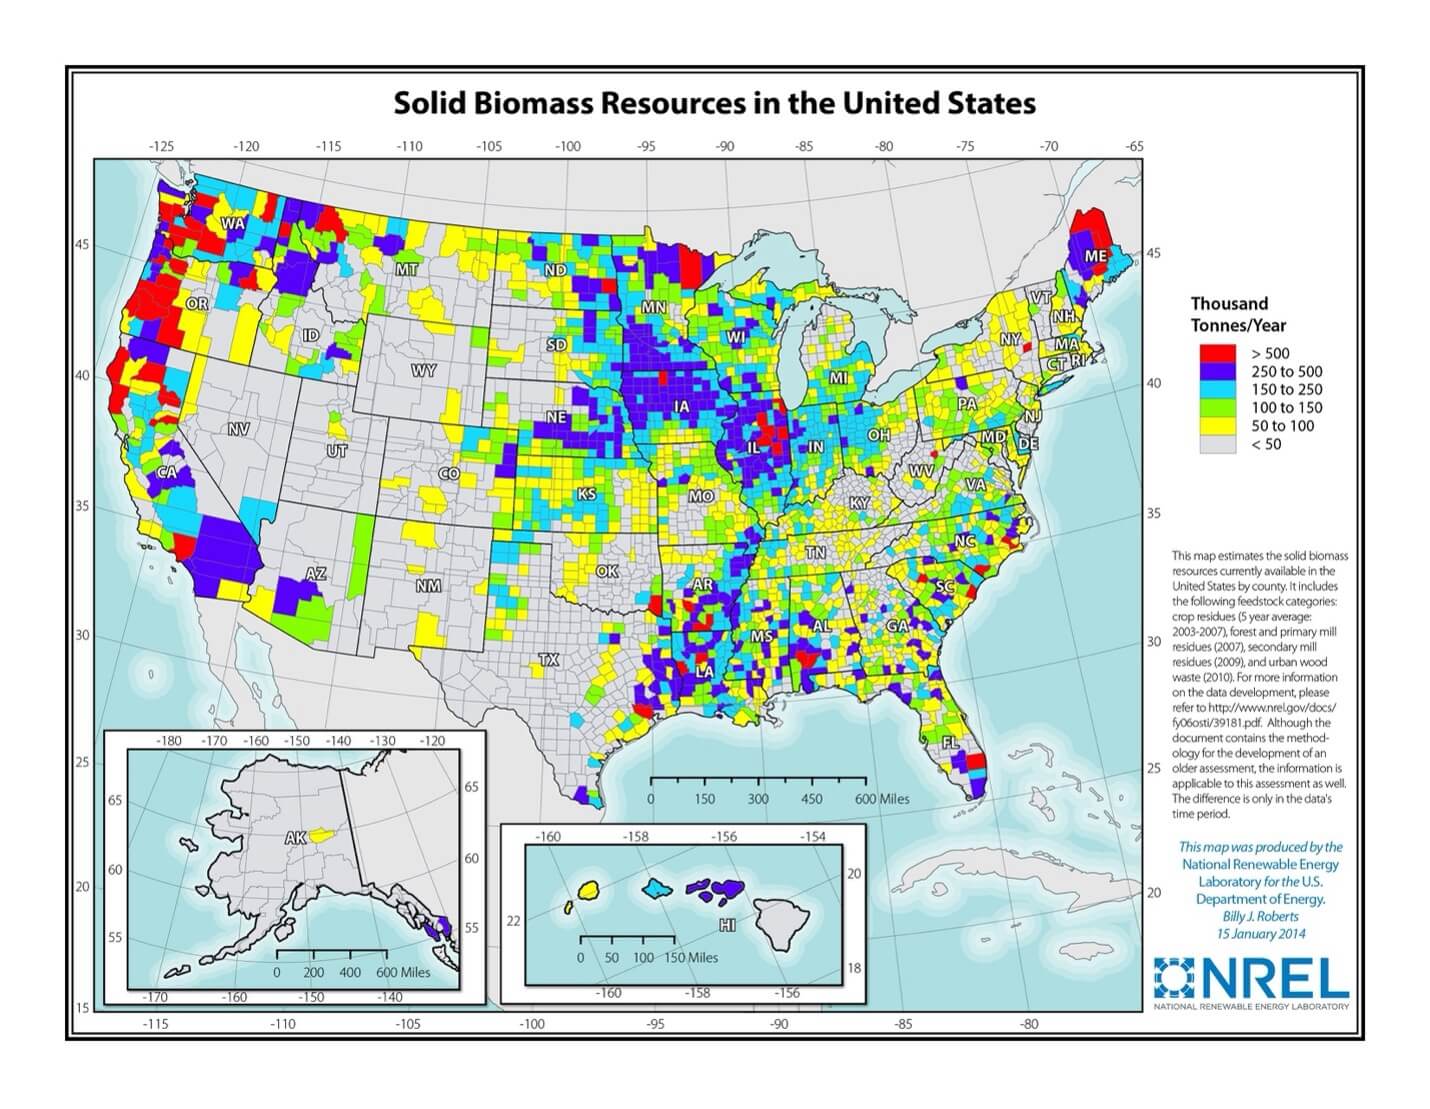
Renewable Energy

At-a-glance

• Renewable energy is the fastest-growing energy source in the United States, with wind and solar generation increasing seven-fold since 2010.

• Renewables made up 22.7 percent of utility-scale U.S. electricity generation in 2024, with the bulk coming from hydropower (5.6 percent), solar (5.1 percent) and wind power (10.5 percent).

• Solar generation (including distributed), which made up 7.1 percent of total U.S. generation in 2024, is the fastest-growing electricity source.

• Globally, renewables made up 32 percent of electricity generation in 2024, an increase of 7 percent from the previous year.

• 741 GW of renewable power capacity was added globally during 2024.

• Renewable ethanol and biodiesel transportation fuels made up more than 32 percent of total U.S. renewable energy consumption in 2024.

Renewable energy is the fastest-growing energy source globally and in the United States.

Globally:
• About 13.5 percent of the energy consumed for heating, power, and transportation came from modern renewables in 2023 (i.e., biomass, geothermal, solar, hydro, wind, and biofuels), up from 9.9 percent a decade prior (see figure below).
• Renewables made up 32 percent of electricity generation by the end of 2023. Led by wind power and solar PV, more than 741 GW of capacity was added in 2024, an increase of nearly 18 percent in total installed renewable power capacity.

The International Energy Agency notes that the development and deployment of renewable electricity technologies are projected to continue to be deployed at record levels, but government policies and financial support are needed to incentivize even greater deployments of clean electricity (and supporting infrastructure) to give the world a chance to achieve its net zero climate goals.

Total Final Energy Consumption by Source, 2013 and 2023

In the United States:

  • Nine percent of total energy consumed across sectors in the United States was from renewable sources in 2024 (8.6 quadrillion Btu out of a total of 94.7 quadrillion Btu). U.S. consumption of renewables is expected to grow over the next 30 years at an average annual rate of 3.5 percent, higher than the overall growth rate in total energy consumption (2.4 percent per year) under a business-as-usual scenario.
  • Renewables made up 22.7 percent of electricity generation in 2024, with hydro, solar and wind making up the majority. That’s expected to riseto 37.4 percent by 2030. Most of the increase is expected to come from wind and solar. Non-hydro renewables have increased their share of electric power generation from around 1 percent in 2005 to 17.1 percent at the end of 2024.

In the transportation sector, renewable fuels, such as ethanol and biodiesel, have increased significantly during the past decade. In 2024, total U.S. biofuel production capacity exceeded 24 billion gallons per year, an increase of 7 percent from 2023. Fuel ethanol accounts for most of U.S. biofuels production capacity and is primarily made from corn starch and blended with gasoline. Between January 2023 and January 2024, U.S. fuel ethanol production capacity rose around 2 percent, and biodiesel capacity remained largely flat. Iowa leads the nation in biofuels production capacity with more than 5.4 billion gallons per year.

In the industrial sector, biomass makes up 98 percent of the renewable energy use with roughly 56 percent derived from biomass wood, 37 percent from biofuels, and nearly 7 percent from biomass waste in 2024.

Uncertainty about federal policy, and economic growth will influence the pace of U.S. renewable energy source development.

Renewable Energy Drivers

Factors affecting renewable energy deployment include market conditions (e.g., cost, diversity, proximity to demand or transmission, and resource availability), policy decisions, (e.g., tax credits, feed-in tariffs, and renewable portfolio standards) as well as specific regulations. Nearly all countries had renewable energy policy targets in place with 89 economy-wide renewable energy targets at the end of 2024.

Businesses with sustainability goals are also driving renewable energy development by building their own facilities (e.g., solar roofs and wind farms), procuring renewable electricity through power purchase agreements, and purchasing renewable energy certificates (RECs).

Wind and solar renewable energy technologies have seen substantial cost declines over the past decade. Between 2010 and 2024, the cost of utility-scale solar photovoltaics fell 90 percent, and the cost of onshore wind fell 70 percent. Increased demand and procurement has required more of these technologies to be manufactured and developed, causing reduced costs due to learning and economies of scale, which increases the incentive for additional procurement.

Global weighted-average LCOE from newly commissioned utility-scale renewable power technologies, 2010-2024

Policy Drivers

Renewable energy comes from sources that can be regenerated or naturally replenished. The main sources are:

  • Water (hydropower and hydrokinetic)
  • Wind
  • Solar (power and hot water)
  • Biomass (biofuel and biopower)
  • Geothermal (power and heating)

All sources of renewable energy are used to generate electric power. In addition, geothermal steam is used directly for heating and cooking. Biomass and solar sources are also used for space and water heating. Ethanol and biodiesel (and to a lesser extent, gaseous biomethane) are used for transportation.

Renewable energy sources are considered to be zero (wind, solar, and water), low (geothermal) or neutral (biomass) with regard to greenhouse gas emissions during their operation. A neutral source has emissions that are balanced by the amount of carbon dioxide absorbed during the growing process. However, each source’s overall environmental impact depends on its overall lifecycle emissions, including manufacturing of equipment and materials, installation as well as land-use impacts.

Water

Large conventional hydropower projects currently provide the majority of renewable electric power generation worldwide at 14.3 percent of total generation. With about 1,277 gigawatts (GW) of global capacity, hydropower produced an estimated 4,578 terawatt hours (TWh) of the roughly 30,900 TWh total global electricity in 2024.

The United States is the fourth-largest producer of hydropower after China, Brazil, and Canada. In 2011, a much wetter than average year in the U.S. Northwest, the United States generated 7.9 percent of its total electricity from hydropower. The Department of Energy has found that the untapped generation potential at existing U.S. dams designed for purposes other than power production (i.e., water supply, flood control, and inland navigation) represents 12 GW, roughly 15 percent of current U.S. hydropower capacity.

Hydropower operational costs are relatively low, and hydropower generates little to no greenhouse gas emissions. The main environmental impact is that a dam to create a reservoir or divert water to a hydropower plant changes the ecosystem and physical characteristic of the river.`

Waterpower captures the energy of flowing water in rivers, streams, and waves to generate electricity. Conventional hydropower plants can be built in rivers with no water storage (known as “run-of-the-river” units) or in conjunction with reservoirs that store water, which can be used on an as-needed basis. As water travels downstream, it is channeled down through a pipe or other intake structure in a dam (penstock). The flowing water turns the blades of a turbine, generating electricity in the powerhouse, located at the base of the dam.

Other Hydroelectric Power Generation

Small hydropower projects, generally less than 10 megawatts (MW), and micro-hydropower (less than 1 MW) are less costly to develop and have a lower environmental impact than large conventional hydropower projects. In 2022, the total amount of small hydro installed worldwide was 79 GW. China had the largest share at 53 percent. China, the United States, Italy, Japan, and Norway are the top five small hydro countries by installed capacity. Many countries have renewable energy targets that include the development of small hydro projects.

Hydrokinetic electric power, including wave and tidal power, is a form of unconventional hydropower that captures energy from waves or currents and does not require dam construction. These technologies are in various stages of research, development, and deployment. In 2011, a 254 MW tidal power plant in South Korea began operation, doubling the global capacity. The estimated operating installed capacity in 2024 was 494 MW with the ocean energy sector forecasting an increase to 300 GW of installed capacity by 2050.

Low-head hydro is a commercially available source of hydrokinetic electric power that has been used in farming areas for more than 100 years. Generally, the capacity of these devices is small, ranging from 1kW to 250kW.

Pumped storage hydropower plants use inexpensive electricity (typically overnight during periods of low demand) to pump water from a lower-lying storage reservoir to a storage reservoir located above the powerhouse for later use during periods of peak electricity demand. Although economically viable, this strategy is not considered renewable since it uses more electricity than it generates.

Hydroelectric Power Generation

Wind

Wind was the second largest renewable energy source worldwide (after hydropower) for power generation. Wind power produced more than 8 percent of global electricity in 2024 with a record breaking 117 GW of new wind power capacity coming online; there is now 1,135 GW of global wind capacity. Capacity is indicative of the maximum amount of electricity that can be generated when the wind is blowing at sufficient levels for a turbine. Because the wind is not always blowing, wind farms do not always produce as much as their capacity. With around 520 GW total installed capacity, China led in wind generation in 2024. The United States, with 154 GW, had the second-largest capacity; Texas, Iowa, Oklahoma, Kansas, and Illinois provide about 59 percent of all U.S. wind generation, with Texas leading all other states in installed capacity, at 28 percent of the U.S. total. Since 2020, wind energy generation in the U.S. has increased 34 percent, providing 10.5 percent of electricity in 2024.

Although people have harnessed the energy generated by the movement of air for hundreds of years, modern turbines reflect significant technological advances over early windmills and even over turbines from just 10 years ago. Generating electric power using wind turbines creates no greenhouse gases, but since a wind farm includes dozens or more turbines, widely spaced, it requires thousands of acres of land. For example, Lone Star is a 200 MW wind farm on approximately 36,000 acres in Texas. However, most of the land in between turbines can still be utilized for farming or grazing.

Average turbine size has been steadily increasing over the past 30 years. Today, new onshore turbines are typically in the range of 2 – 5 MW while new offshore turbines average 10 GW in nameplate capacity. The largest wind turbine built to date has a capacity of 26 GW and is located in China. Due to higher costs and technology constraints, offshore capacity, approximately 83 GW in 2024, is only a small share (about 7 percent) of total global installed wind generation capacity.

Wind Turbine Sizes

Solar

Solar energy resources are massive and widespread, and they can be harnessed anywhere that receives sunlight. The amount of solar radiation, also known as insolation, reaching the Earth’s surface every hour is more than all the energy currently consumed by all human activities each year. A number of factors, including geographic location, time of day, and weather conditions, all affect the amount of energy that can be harnessed for electricity production or heating purposes.

Solar photovoltaics are the fastest growing electricity source. In 2024, around 602 GW of global capacity was added, accounting for 81 percent of the total renewable electricity capacity increase. This addition brings the total capacity to over 2 TW (i.e., ~2,250 GW) and with solar producing almost 7 percent (i.e., 2,132 TWh) of the world’s electricity.

Solar energy can be captured for electricity production using:

  • A solar or photovoltaic cell, which converts sunlight into electricity using the photoelectric effect. Typically, photovoltaics are found on the roofs of residential and commercial buildings. Additionally, utilities have constructed large (greater than 100 MW) photovoltaic facilities that require anywhere from 5 to 7 acres per MW, depending on the technologies used and other factors (e.g., location, topography, buffers). In the United States, non-residential solar (e.g. utility- and commercial-scale) installations made up 138 GW, while residential solar (e.g. rooftop) installations made up 36.5 GW at the end of 2024.
  • Concentrating solar power (CSP), which uses lenses or mirrors to concentrate sunlight into a narrow beam that heats a fluid, producing steam to drive a turbine that generates electricity. Concentrating solar power projects are larger-scale than residential or commercial PV and are often owned and operated by electric utilities.
  • Although utility-scale CSP plants were in operation long before solar photovoltaics became widely commercialized, solar photovoltaics have largely taken over this market, due to their declining costs. Global CSP capacity grew less than 1 percent in 2024 to 7.2 GW.

Solar hot water heaters, typically found on the roofs of homes and apartments, provide residential hot water by using a solar collector, which absorbs solar energy, that in turn heats a conductive fluid, and transfers the heat to a water tank. Modern collectors are designed to be functional even in cold climates and on overcast days.

Electricity generated from solar energy emits no greenhouse gases. The main environmental impacts of solar energy come from the use of some hazardous materials (arsenic and cadmium) in the manufacturing of PV and the large amount of land required, hundreds of acres, for a utility-scale solar project.

Concentrating Solar Power

Biomass

Biomass energy sources are used to generate electricity and provide direct heating and can be converted into biofuels as a direct substitute for fossil fuels used in transportation. Unlike intermittent wind and solar energy, biomass can be used continuously or according to a schedule. Biomass is derived from wood, waste, landfill gas, crops, and alcohol fuels. Traditional biomass, including waste wood, charcoal, and manure, has been a source of energy for domestic cooking and heating throughout human history. In rural areas of the developing world, it remains the dominant fuel source. Globally in 2022, bioenergy accounted for about 5.8 percent of total final energy consumption. The growing use of biomass has resulted in increasing international trade in biomass fuels in recent years; wood pellets, biodiesel, and ethanol are the main fuels traded internationally.

In 2024, global biomass electric power capacity stood at 150.8 GW, increasing 3 percent from the previous year, the slowest rate in the last decade. The United States had 13 GW of installed biomass-fueled electric generation capacity. In the United States, most of the electricity from wood biomass is generated at lumber and paper mills using their own wood waste; in addition, wood waste is used to generate the heat for drying wood products and other manufacturing processes. Biomass waste is mostly municipal solid waste, i.e., garbage, which is burned as a fuel to run power plants. On average, a ton of garbage generates 550 to 750 kWh of electricity. Landfill gas contains methane that can be captured, processed and used to fuel power plants, manufacturing facilities, vehicles and homes. In the United States, there is currently around 1.7 GW of installed landfill gas-fired generation capacity across more than 500 projects.

In addition to landfill gas, biofuels can be synthesized from dedicated crops, trees and grasses, agricultural waste, and algae feedstock; these include renewable forms of diesel, ethanol, butanol, methane, and other hydrocarbons. Corn ethanol is the most widely used biofuel in the United States. Roughly 38 percent of the U.S. corn crop was diverted to the production of ethanol for gasoline in 2023, up from 20 percent in 2006. Gasoline with up to 10 percent ethanol (E10) can be used in most vehicles without further modification, while special flexible fuel vehicles can use a gasoline-ethanol blend that has up to 85 percent ethanol (E85).

Closed-loop biomass, where power is generated using feedstocks grown specifically for the purpose of energy production, is generally considered to be carbon dioxide neutral because the carbon dioxide emitted during combustion of the fuel was previously captured during the growth of the feedstock. While biomass can avoid the use of fossil fuels, the net effect of biopower and biofuels on greenhouse gas emissions will depend on full lifecycle emissions for the biomass source, how it is used, and indirect land-use effects. Overall, however, biomass energy can have varying impacts on the environment. Wood biomass, for example, contains sulfur and nitrogen, which yield air pollutants sulfur dioxide and nitrogen oxides, though in much lower quantities than coal combustion.
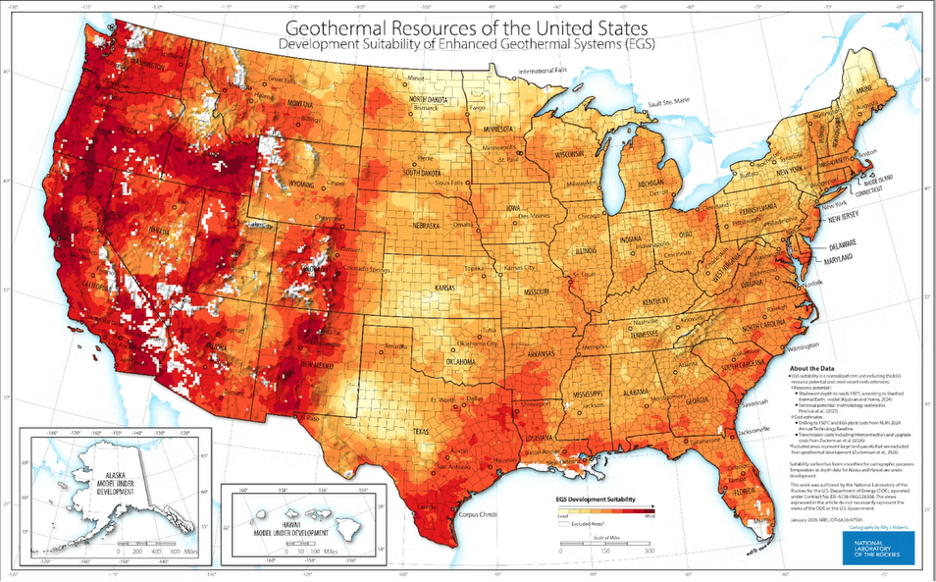
Geothermal

Geothermal provided an estimated 344 TWh globally in 2024, with 99 TWh in the form of electricity (with an estimated 15.1 GW of capacity) and the remaining half in the form of heat. (Total global electricity generation in 2024 was over 30,000 TWh).

In the United States, nearly 16 TWh of geothermal electricity was generated in 2024, making up about 0.4 percent of total electricity generation. Seven states generated electricity from geothermal energy: California, Hawaii, Idaho, Nevada, New Mexico, Oregon and Utah. Of these, California accounted for two-thirds of this generation.

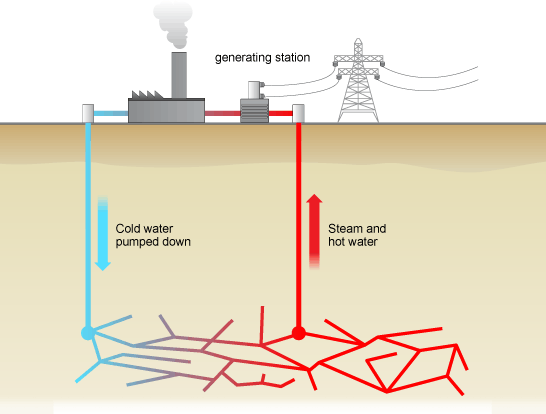
Traditional geothermal energy exploits naturally occurring underground heat, water and permeability, located relatively close to the Earth’s surface in some areas, to generate electric power and for direct uses such as heating and cooking. Geothermal areas are generally located near tectonic plate boundaries, where there are earthquakes and volcanoes. In some places, hot springs and geysers have been used for bathing, cooking and heating for centuries

Generating geothermal electric power typically involves drilling a well, perhaps a mile or two in depth, in search of rock temperatures in the range of 300 to 700°F. Water is pumped down this well, where it is reheated by hot rocks. It travels through natural fissures and rises up a second well as steam, which can be used to spin a turbine and generate electricity or be used for heating or other purposes. Several wells may have to be drilled before a suitable one is in place and the size of the resource cannot be confirmed until after drilling. Additionally, some water is lost to evaporation in this process, so new water is added to maintain the continuous flow of steam. Like biopower and unlike intermittent wind and solar power, geothermal electricity can be used continuously. Very small quantities of carbon dioxide trapped below the Earth’s surface are released during this process.

Geothermal Power Station

Since most areas do not have access to the naturally occurring conditions necessary to create geothermal energy, next generation geothermal technologies use advanced, often experimental, drilling and fluid injection techniques to augment and expand the availability of geothermal resources.  Enhanced geothermal systems (EGS) inject fluid deep underground to create new fractures and cause pre-existing fractures to re-open, creating the necessary permeability for water to flow and become heated from hot rocks deep below the surface. Closed loop geothermal systems are another type of next generation geothermal technology where fluids circulate through a closed loop system of pipes. These technologies have the potential to greatly expand the availability of geothermal energy beyond a few specific geographic regions.

Global Investment in Renewable Power and Fuels, by Technology, 2015-2024

Renewable Power Total Installed Capacity and Additions, By Technology, 2024

U.S. Renewable Resource Availability

The following maps from the DOE National Laboratory of the Rockies depict the relative availability of renewable energy resources throughout the United States.

  • Wind resources are abundant in the Great Plains, Iowa, Minnesota, along the spine of Appalachian Mountains, in the Western Mountains, and many off-shore locations.
  • Solar photovoltaic and concentrating solar power resources are the highest in the desert Southwest and diminish in intensity in a northward direction.
  • The best biomass resources are in the upper central plains (corn) and forests of the Pacific Northwest.
  • Suitable enhanced geothermal system resources are mostly concentrated in the Western U.S.; however, there are some promising areas in the Eastern U.S.

U.S. Wind Resource Map

U.S. Photovoltaic Solar Resources

U.S. Biomass Resource

U.S. Geothermal Resource