The state of New York has passed a budget that includes a new EV purchase incentive that will provide up to $2,000 for eligible buyers of an all-electric vehicle, a plug-in hybrid EV, or a hydrogen fuel cell vehicle. Meanwhile in Minnesota, legislators have been considering an EV purchase incentive.
The CEO of the Freedom Foundation of Minnesota criticized EV purchase incentives as “a reverse Robin Hood scheme,” without the green tights, that takes money from the many (taxpayers) and subsidizes the purchases of the few (elites who buy EVs). How accurate is the assertion that the wealthy benefit the most from purchase incentives?
A free EV data tool from the New York State Energy Research and Development Authority can provide some insight. Developed with support from C2ES, EValuateNY gives users access to wide-ranging data sources from New York State’s EV market and allows easy comparisons of the factors that affect EV sales. You can find more about the tool in a previous blog post.
Our initial assessment, examining the period before the purchase incentive program has been implemented, shows that the EV market extends well beyond New York’s wealthiest counties.
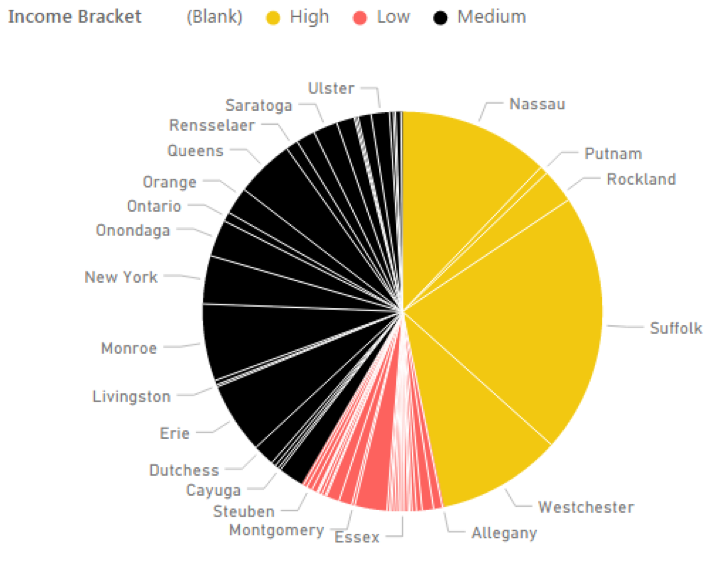
Using the U.S. Census Bureau’s data on median household income by county, we established three income brackets to compare wealth between counties. Next, we broke down EV registrations by county and income bracket from the beginning of the EV market (2010) to the most recent data in EValuateNY (2014). The results show that counties with high median incomes account for slightly less than half the state’s total EV registrations.
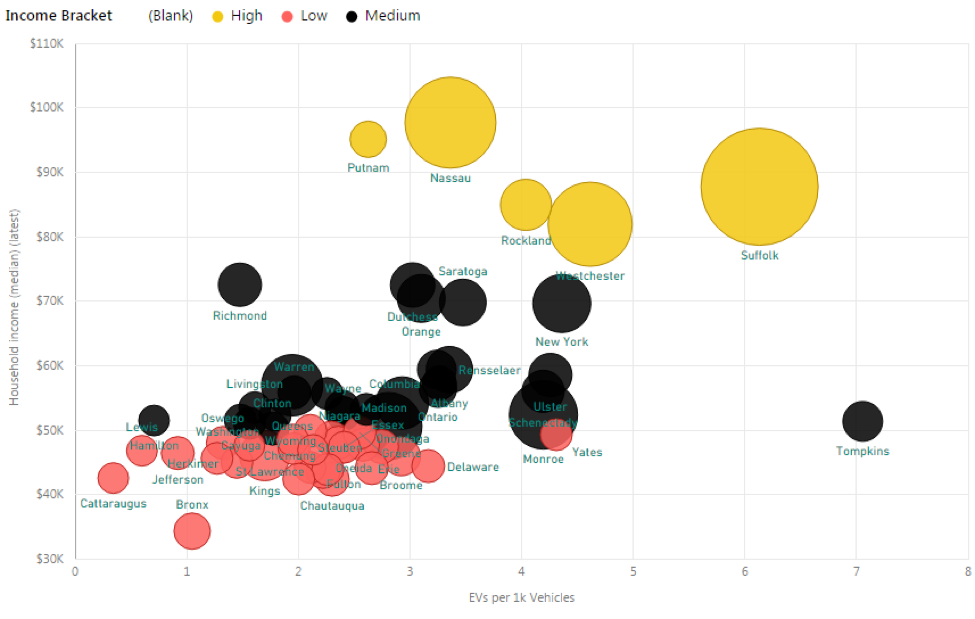
Therefore, EVs are not solely purchased in high-income counties, though households with high incomes are found in each county. However, EV registrations in three high-income counties (Suffolk, Nassau, and Westchester) account for more than 43 percent of the state’s total registrations, but only about 22 percent of the population. Clearly, these high-income counties have a higher rate of EV registrations. To dive deeper, we used EValuateNY to plot the rate of EV purchases per 1,000 vehicle registrations by county and income level, shown in Figure 2. Using a rate of EV purchases helps eliminate other factors that may affect the data, such as population or the rate of vehicle ownership. We also added the total number of EV registrations as the size of the bubble representing each county.