Publication
Insights on Electric Trucks for Retailers and Trucking Companies
The Center for Climate and Energy Solutions (C2ES) has partnered […]

The transportation sector is the largest direct source of U.S. greenhouse gas emissions, surpassing the power sector in 2015. Cars and light-duty trucks (including pickups and SUVs) are responsible for 57.5 percent of transportation emissions. Medium- and heavy-duty vehicles, which include tractor-trailers, large pickups and vans, delivery trucks, buses, and garbage trucks, produce about 26 percent of transportation emissions.
In April 2010, the federal government finalized the first harmonized set of standards for light-duty vehicles with the cooperation of major automakers and the state of California. The Environmental Protection Agency (EPA) established greenhouse gas emission standards and the National Highway Traffic Safety Administration (NHTSA) established corporate average fuel economy (CAFE) standards. The first CAFE standards were adopted in 1975, and the first greenhouse gas vehicle standards were adopted in 2010.
The 1975 Energy Policy and Conservation Act directed the U.S. Secretary of Transportation to establish Corporate Average Fuel Economy (CAFE) standards for new passenger cars. CAFE is the sales-weighted average fuel economy in miles per gallon (mpg) of the vehicles in a manufacturer’s fleet. This law was updated in 2007, when Congress increased the fuel economy standards for passenger vehicles and also established efficiency standards for medium- and heavy-duty vehicles.
California is the only state allowed to set its own air emissions standards for motor vehicles. California was granted an exception under the Clean Air Act because the state had already implemented standards in 1966 to address its critical smog problem and had established an Air Resources Board (CARB) to oversee them. The Clean Air Act states EPA shall grant a waiver if California’s standards are necessary to meet compelling circumstances and are at least as stringent as federal standards. Other states may choose to adopt California’s vehicle emissions standards without EPA approval. Seventeen states and the District of Columbia, making up about 40 percent of U.S. auto sales, currently follow at least some of California’s vehicle emissions standards.
In August 2021, President Biden signed Executive Order 14037, Strengthening American Leadership in Clean Cars and Trucks. The order sets a non-binding target of making 50 percent of all new passenger car and light truck sales ZEVs in 2030. Under the order, “zero-emission vehicles” include battery electric, plug-in hybrid electric, and hydrogen fuel cell electric vehicles. The order was supported by leading U.S. automakers, including Ford, General Motors, and Stellantis, who have voluntary targets to make 40–50 percent of all sales electric by 2030. Labor groups including the United Auto Workers union supported the order as well.
In addition to setting the target, the executive order directs EPA and NHTSA to begin the rulemaking process to set emissions and fuel economy standards for passenger cars and light trucks that extend through model year 2030, to be finalized no later than July 2024. It also directs the agencies to issue standards for medium- and heavy-duty trucks for model years 2027 through 2030, which were finalized in December 2022.
Vehicle emission and fuel economy standards have varied since they were established in 1975. Most recently, in August 2021, the Biden administration proposed new and revised standards for passenger cars and light-duty vehicles for model years 2023 to 2026. In December 2021, EPA released the final rule setting greenhouse gas emissions standards through model year 2026. Additionally, President Biden signed Executive Order 14037, setting a nonbinding target of making 50 percent of passenger car and light truck sales zero-emission by 2030. The executive order also directs EPA and NHTSA to establish new fuel economy and emissions standards for passenger vehicles for model years 2027–2030 to be finalized no later than July 2024.
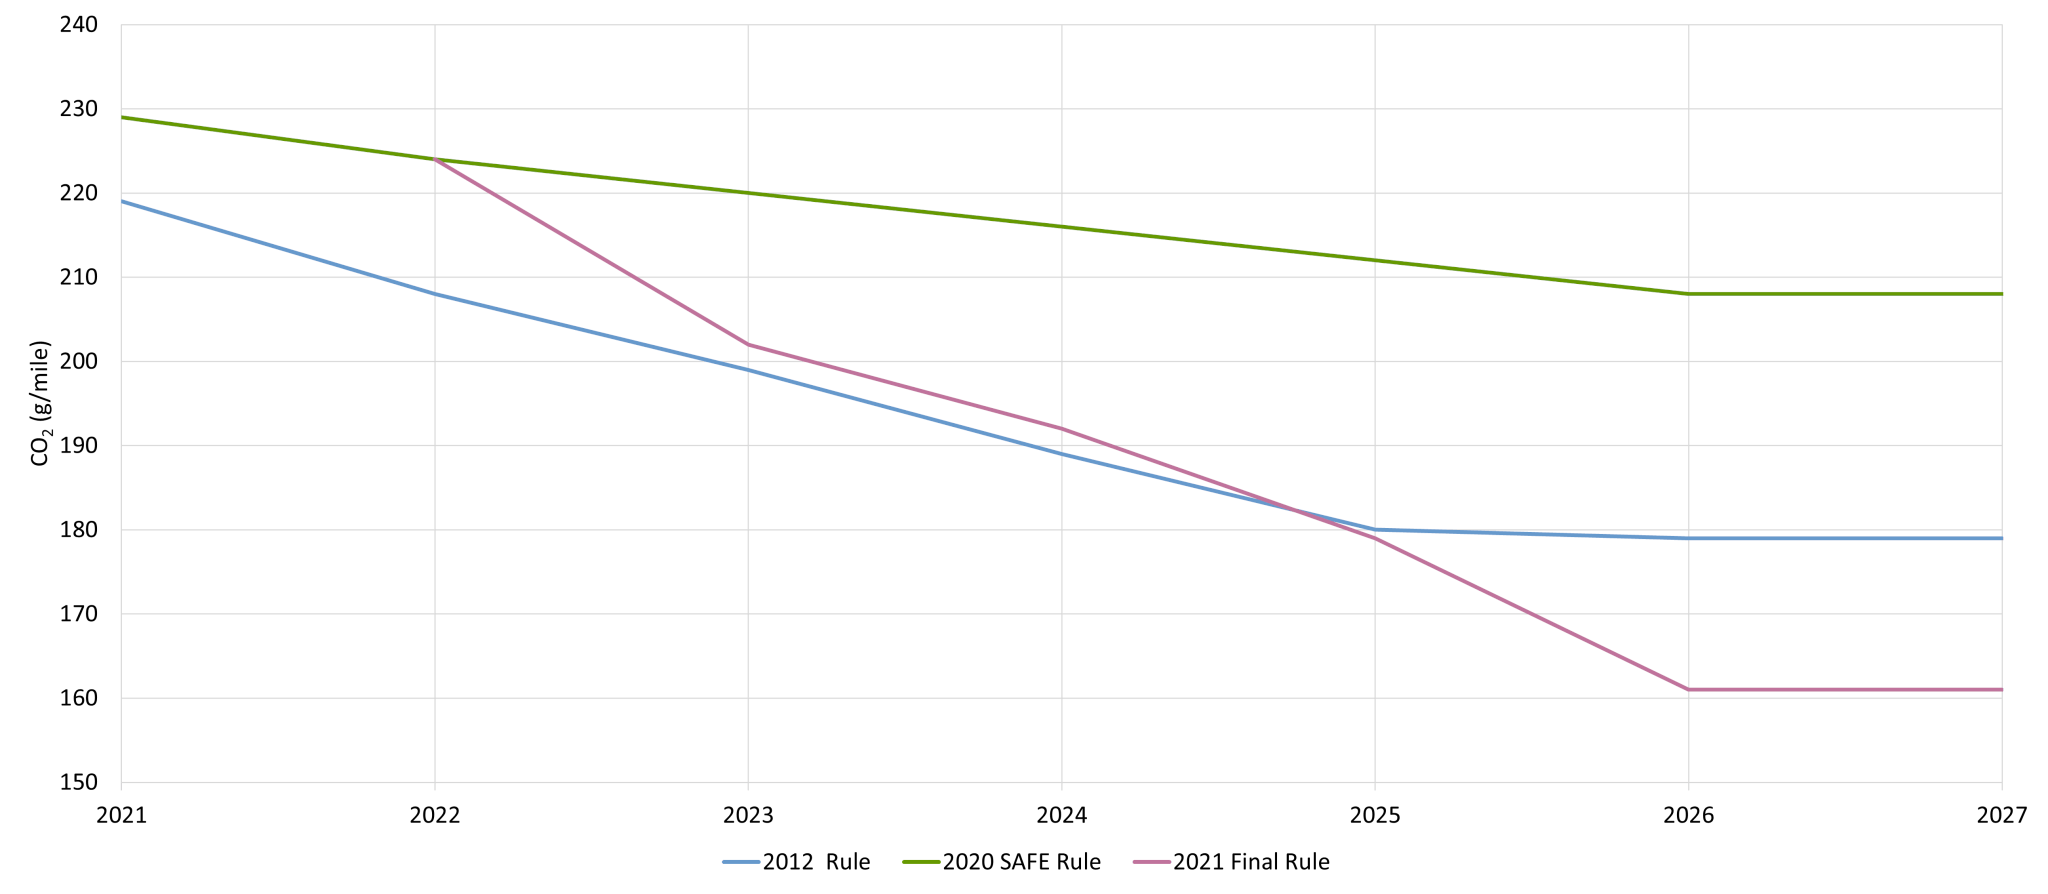
In December 2021, the Environmental Protection Agency (EPA) issued new greenhouse gas emission standards for new passenger cars and light-duty trucks. The final rule requires automakers to reach a projected industry-wide target of 161 carbon dioxide grams per mile (g/mi) in 2026, which increases in stringency by 9.8 percent from model years 2022 to 2023, 5.1 percent in model year 2024, 6.6 percent in model year 2025, and 10.3 percent in model year 2026.
The rule is expected to result in 3.1 billion tons of avoided carbon dioxide emissions through 2050 and reduce gasoline use by 360 billion gallons. The ambitious standards yield net economic benefits of $120 billion to $190 billion over that period, including $8 billion to $19 billion in public health benefits as a result of lower tailpipe emissions of other pollutants responsible for smog and soot, and saving consumers hundreds of billions of dollars at the pump.
2023–2026 Fleet-wide carbon dioxide (CO2) and fuel economy standards
| Vehicle | Standard | 2023 | 2024 | 2025 | 2026 |
| Passenger Cars | CO2 (g/mi) | 166 | 158 | 149 | 132 |
| CO2 equiv. mpg | 54 | 56 | 60 | 67 | |
| CAFE (mpg) | 49.2 | 53.4 | 59.4 | ||
| Light Trucks | CO2 (g/mi) | 234 | 222 | 207 | 187 |
| CO2 equiv. mpg | 38 | 40 | 43 | 48 | |
| CAFE (mpg) | 35.1 | 38.2 | 42.4 | ||
| Combined Cars & Light Trucks | CO2 (g/mi) | 202 | 192 | 179 | 161 |
| CO2 equiv. mpg | 44 | 46 | 50 | 55 | |
| CAFE (mpg) | 40.7 | 44.2 | 49.2 |
Note: EPA’s greenhouse gas emissions standards are expressed in carbon dioxide grams per mile (g/mi) while NHTSA’s proposed fuel economy standard is expressed in miles per gallon (mpg). EPA’s rule also includes an estimated impact on fuel economy (shown as CO2 equivalent mpg), which assumes the rule is met exclusively by reducing tailpipe carbon dioxide.
EPA’s final rule retains and reinstates several flexibilities and incentives from previous rules, including maintaining the existing program for credit-based averaging, banking, and trading of greenhouse emissions first established in 2010. While the draft rule proposed extending the lifetime of earlier years’ credits to make it more flexible, EPA explains in the final rule that it believes the current trajectory of the electric vehicle market combined with the leniency under the previous SAFE rule will allow automakers to meet the standards without needing to extend the lifetime of the oldest credits. The rule temporarily restores the advanced technology vehicle multiplier credits established under the Obama administration but removed by the Trump administration, which allowed zero- and near-zero-emission vehicles to be weighted stronger toward meeting standards than conventional vehicles. This multiplier will only apply in model years 2023-2024 to support the transition to more stringent standards. Additionally, it reinstates the off-cycle credits program allowing automakers to count non-exhaust energy efficiency improvements that reduce hydrofluorocarbon (HFC) or other emissions towards overall greenhouse gas emissions reductions for model years 2023 through 2026. Finally, the rule restores full-size pickup truck incentives for hybrids for model years 2023-2024, which were originally removed by the SAFE rule.
In addition to EPA’s greenhouse gas emission standards, the National Highway Traffic Safety Administration (NHTSA) finalized new fuel economy standards for new passenger cars and light trucks for model years 2024–2026 in March 2022. The standards increase fuel efficiency eight percent each year in model years 2024-2025 and ten percent in model year 2026, reaching a fleetwide average of 49 mpg by 2026, an increase of almost 10 mpg from model year 2021. While NHTSA and EPA often coordinate fuel economy and greenhouse gas standards, NHTSA is required to provide more lead time than EPA. The agencies proposed standards with different effective dates to reflect this.
Both EPA and NHTSA cited significant manufacturer commitments to ramp up production of electric vehicles and to improve fleetwide efficiency in the coming years as justification that manufacturers will be able to meet the more stringent standards in the proposals. Additionally, both agencies cited the voluntary agreement five automakers (BMW, Ford, Honda, Volkswagen, and Volvo) made with the state of California to meet significantly more stringent emissions standards than those set by the SAFE rule, demonstrating their existing commitments to significantly exceed those standards.
In April 2020, EPA and NHTSA issued the Safer Affordable Fuel Efficient (SAFE) Vehicles Rule, which required automakers to improve fuel efficiency 1.5 percent annually from model years 2021 through 2026. The SAFE rule was less stringent than the Obama-era rule it replaced. That rule would have required automakers to improve fuel efficiency 5 percent annually for model year 2020–2025 vehicles, reaching 46.7 miles per gallon (mpg) by 2025.
The SAFE rule justification projected that increased fuel efficiency standards have a “rebound effect” that encourages more driving and therefore more exposure to the risk of traffic accidents; that higher vehicle costs from increased fuel efficiency standards discourage consumers from purchasing new vehicles and encourage them to keep driving older, less safe vehicles; and that manufacturer “lightweighting” of vehicles to achieve fuel efficiency makes vehicles less safe. EPA and NHTSA projected the SAFE rule would reduce vehicle costs by more than $1,000, but consumers will spend between $1,125 and $1,425 dollars more on fuel costs over the life of the vehicle. The SAFE rule was also projected to slow electrification rates by 2029 to 7.9 percent compared to 19.6 percent under the Obama-era rules.
The SAFE rule also upended state emission programs. In September 2019, EPA and NHTSA issued a final action that enabled federal vehicle standards to preempt state action and withdrew the waiver for California’s Advanced Clean Cars Program, Zero Emission Vehicle Program (ZEV), and Low-Emission Vehicle Program (LEV). In response, California and other states sued in federal court to challenge the final action on preemption of state vehicle standards. In April 2021, the Biden administration EPA and Department of Transportation startedbegan the process of dropping the limitations on California’s waiver. In December 2021, NHTSA issued a repealing the SAFE Vehicle Rule Part One, and in March 2022, EPA did the same, thereby reinstating California’s waiver and the ability of other states to adopt the California standards.
In October 2012, EPA and NHTSA finalized the second set of national program standards for model year 2017–2025 light-duty vehicles with the cooperation of major automakers and the state of California. These standards aimed to raise the combined average fleet fuel efficiency to 46.7 mpg for model year 2025, nearly double the 27.5 mpg required for model year 2010 (before the first set of national program standards were adopted). Canada also adopted standards aligned with the second set of national program standards through model year 2025.
These standards included features aimed at improving flexibility, making compliance more cost-effective and encouraging technological innovation. Features for greater flexibility included:
In January 2017, following a mid-term review of these standards and draft technical assessment, the Obama administration maintained standards through 2025. EPA cited the success of automakers in meeting early standard requirements and a seven-year growth in U.S. auto sales as reasons to expect that automakers could affordably continue to meet the standards. The California Air Resources Board (CARB) concurred with the EPA’s determination in its own midterm review of California’s vehicle standards. California found that automakers were successfully and affordably deploying advanced technologies to meet fuel economy requirements and the state’s Advanced Clean Cars Program, Zero Emission Vehicle Program (ZEV), and Low-Emission Vehicle Program (LEV).
In April 2018, the Trump administration reconsidered the midterm evaluation for greenhouse gas emission standards for model year 2022–2025 light-duty vehicles. EPA concluded that the standards were based on outdated information and that more recent information suggested that the current standards may be too stringent, making vehicles less affordable. EPA concluded that since the 2012 rulemaking finalizing the initial standards, expectations about gas prices and consumer adoption of advanced technology vehicles had changed. This led to the Safer Affordable Fuel Efficient (SAFE) Vehicles Rule, which required automakers to improve fuel efficiency 1.5 percent annually from model years 2021 through 2026. The SAFE rule was less stringent than the Obama-era rule it replaced. That rule would have required automakers to improve fuel efficiency 5 percent annually for model year 2020–2025 vehicles, reaching 46.7 miles per gallon (mpg) by 2025.
The SAFE rule justification projected that increased fuel efficiency standards have a “rebound effect,” encouraging more driving and therefore more exposure to the risk of traffic accidents; that higher vehicle costs from increased fuel efficiency standards discourage consumers from purchasing new vehicles and encourage them to keep driving older, less safe vehicles. It further projected that manufacturer “lightweighting” of vehicles to achieve fuel efficiency makes vehicles less safe. EPA and NHTSA projected the SAFE rule would reduce vehicle costs by more than $1,000, but consumers would spend between $1,125 and $1,425 dollars more on fuel costs over the life of the vehicle.
In response, a California-led group of 23 states and the District of Columbia sued in federal court to challenge EPA’s reconsideration. The group included California, Colorado, Connecticut, Delaware, Hawaii, Illinois, Maine, Maryland, Massachusetts, Michigan, Minnesota, Nevada, New Jersey, New Mexico, New York, North Carolina, Oregon, Pennsylvania, Rhode Island, Vermont, Virginia, Washington, Wisconsin, and the District of Columbia. The lawsuit alleged that EPA’s decision lacked scientific justification.
The SAFE rule also upended state emission programs. In September 2019, EPA and NHTSA enabled federal vehicle standards to preempt state action and withdrew the waiver for California’s Advanced Clean Cars Program, Zero Emission Vehicle Program (ZEV), and Low-Emission Vehicle Program (LEV). In response, California and other states sued in federal court to challenge the final action on preemption of state vehicle standards.
In January 2021, President Biden signed Executive Order 13990, Protecting Public Health and the Environment and Restoring Science To Tackle the Climate Crisis. Of relevance, the executive order directed EPA and NHTSA to “begin the process of proposing a rule suspending, revising, or rescinding the SAFE Vehicles Rules.” In addition, the Biden Administration dropped the EPA’s and Department of Transportation’s defenses against the lawsuit and began restoring California’s waiver under the Clean Air Act. In August 2021, President Biden signed an executive order on “Strengthening American Leadership in Clean Cars and Trucks,” which sets a nonbinding target of making 50 percent of passenger cars and light-duty trucks ZEVs by 2030. In December 2021, NHTSA repealed the SAFE Vehicle Rule Part One, and in March 2022, EPA did the same, thereby reinstating California’s waiver and the ability of other states to adopt the California standards.
Medium- and heavy-duty trucks make up only 5 percent of vehicles on the road but account for about 24 percent of U.S. transportation emissions. This category includes tractor-trailers, large pickups and vans, delivery trucks, buses, and garbage trucks.
Phase 2 standards developed by EPA and NHTSA currently apply to semi-trucks, large pickup trucks, vans, and all buses and work trucks of model years 2021–2027. Phase 2 standards for box trailers that would have gone into effect in 2018 have been stayed by court order. EPA has proposed to repeal Phase 2 emissions standards for heavy-duty glider vehicles, glider engines, and glider kits.
In August 2021, President Biden’s Executive Order 14037, Strengthening American Leadership in Clean Cars and Trucks, directed EPA to establish new emissions standards for heavy-duty vehicles for model years 2027 through 2030 or later. The order called for EPA to finalize this rulemaking by December 2022.
In December 2022, the EPA final rule set new, more stringent standards to reduce nitrogen oxide (NOx) pollution from heavy-duty vehicles and engines starting in model year 2027. In addition to its climate impacts, NOx is a major contributor to ground-level air pollution. The rule will reduce NOx emissions from heavy-duty trucks by almost 50 percent by 2045, producing significant health-related benefits.
EPA plans to release proposals for the next set of standards, Phase 3 greenhouse gas standards, for model years 2027 and later by the end of March 2023.
In 2007, Congress directed the Department of Transportation to establish efficiency standards for medium- and heavy-duty vehicles after consultation with the Department of Energy and EPA. In 2011, EPA and NHTSA established the heavy-duty national program (known as the Phase 1 standards), the world’s first harmonized greenhouse gas emissions standards and fuel economy standards for on-road heavy-duty vehicles of model years 2014-2018. The Phase 1 standards applied to combination tractors, heavy-duty pickup trucks and vans, and vocational vehicles. Some of the standards are exclusively within EPA’s jurisdiction, such as hydrofluorocarbon standards limiting leakage from vehicle air-conditioning systems from certain heavy-duty vehicles, and nitrous oxide and methane emissions standards for pickup trucks and vans and heavy-duty engines. The Phase 1 standards did not apply to commercial trailers.
In August 2016, EPA and NHTSA finalized the Phase 2 standards for medium and heavy-duty vehicles. The Phase 2 standards were designed to apply to certain trailers of model years 2018–2027 and to semi-trucks, large pickup trucks, vans, and all buses and work trucks of model years 2021–2027.
The Phase 2 standards are divided into five segments, designed to help provide manufacturers with flexibility.
To provide manufacturers flexibilities, the program allows averaging, banking, and trading among regulated parties to speed implementation of new technologies and reduce the cost of compliance.
Following President Biden’s Executive Order 14037, Strengthening American Leadership in Clean Cars and Trucks, EPA announced it would release new standards for trucks in three phases, beginning with stronger nitrogen oxide standards for heavy-duty trucks beginning in model year 2027, setting stronger emissions standards for medium-duty commercial vehicles for model year 2027 and later in conjunction with new standards for light-duty vehicles for model year 2027 and beyond, and setting Phase 3 greenhouse gas standards for heavy-duty vehicles beginning as soon as model year 2030 that are significantly stronger than the standards beginning in model year 2027.
If the average fuel economy of a manufacturer’s fleet does not meet the standard set under the NHTSA rules, the manufacturer must pay a penalty. Automakers cannot opt out of reporting their fuel economies by choosing to pay a fine instead. The penalty for failing to meet the CAFE standards is based on the difference between the manufacturer’s fleet average fuel economy and the annual standard, and costs $14 per tenth of a mile per gallon, multiplied by the number of vehicles in the manufacturer’s fleet.
The penalty was originally set in 1975 at $5.50 per tenth of a mile per gallon. In 2015, the Inflation Adjustment Act required federal agencies to adjust civil monetary penalties to reflect inflation. In 2016 NHTSA raised the civil penalty rate from $5.50 to $14 but stated that it would not apply the adjusted rate until model year 2019 to allow sufficient lead time for manufacturers to adapt.
In July 2017, NHTSA delayed the effective date of the new $14 penalty indefinitely while it requested a new round of public input, effectively maintaining the $5.50 rate.
In response, the National Resources Defense Council (NRDC) and other environmental groups—as well as the states of California, Maryland, New York, Pennsylvania, and Vermont—sued NHTSA to keep the higher penalty in place while it reconsidered the amount. In June 2018, the Second U.S. Circuit Court of Appeals vacated the 2017 rule, declaring NHTSA does not have the legal authority to indefinitely delay the penalties.
In July 2019, NHTSA determined that the CAFE civil penalty rate is not a civil monetary penalty that must be adjusted under the Inflation Adjustment Act. In response, NRDC and Sierra Club sued NHTSA. In August 2020, the Second U.S. Circuit Court of Appeals reinstated the $14 penalty, unanimously ruling that the CAFE penalty is a civil monetary penalty because it meets the legal definitions under the Inflation Adjustment Act. Also, the NHTSA had previously treated the CAFE penalty as a civil monetary penalty.
In January 2021, in the final days of the Trump administration, in an interim final rule, NHTSA delayed the effective date of the increase to model year 2022. However, in March 2022 under the Biden administration, the agency reinstated the effective date of 2019. This was in keeping with the two decisions by the Second U.S. Circuit Court of Appeals, additional suits over the rule, and numerous comments received in response to the 2021 interim final rule.