
The Earth is undoubtedly warming, hitting a high mark just last year. Fourteen of the 15 hottest years since we started keeping records over 100 years ago have happened since 2000.
Taking the Earth’s TemperatureMeasuring temperature may seem like a straight-forward task. But taking the temperature of the entire planet can be complicated. People are only living on a small portion of the Earth’s surface. Moreover, it is challenging to put together old and new records from many different instruments and methods. Here are some examples of challenges that exist in combining temperature records: Buoys vs. ships: Buoys are programmed to measure temperature at specific intervals. Ship-based measurements are less regulated and are often taken voluntarily, at the convenience of the crew. It can be difficult to compare data if measurements are not synchronized. Measurement techniques on ships: A small but significant percentage of ship-based measurements are still taken using buckets dipped into the ocean, in contrast to the widely-practiced method of using thermometers mounted under the water at engine cooling intakes. The bucket method can introduce multiple biases – human error, evaporation rates, bucket material and condition – that are not present with underwater ship-based and buoy measurements. Getting sufficient coverage: People and technology are not evenly distributed around the planet. Due to a lack of spatial uniformity, temperature data in polar regions – locations warming faster than the rest of the planet – is sparse. However, as new sensors are installed in increasingly remote locations and more robust data sets are developed, scientists can access more information about the Earth’s surface to better estimate the global temperature. |
But was there a slowdown in the rate of warming in the last 15-20 years, a “hiatus”?
Researchers at the National Oceanic and Atmospheric Administration (NOAA) say no.
Earlier research appeared to show that the rate of warming from 1998 to 2012 was less than half the rate of previous decades, prompting some to say global warming had “paused.” Looking at the newest data, however, NOAA researchers have concluded that the perception of a hiatus is “no longer valid.” In other words, they argue that recent warming has been larger than previously reported.
What is new about NOAA’s analysis?
The NOAA team updated estimates of the planet’s surface temperature in four ways:
- Reconciling differences between ocean temperature measurements made by buoys, which are more recent and appear to be higher quality, and by ships, which constitute most of our ocean temperature readings in the early part of the 20th century.
- Reconciling differences between ocean temperature readings made using water in ships’ engine intakes versus those made using buckets (see Box).
- Incorporating recently released ground-based temperature measurements, which include better coverage, especially in the Arctic.
- Adding data from 2013 and 2014. These years were some of the warmest on record, and including them boosts the recent warming trend.
Following these corrections, the rate of warming during 1950-1999 (0.113°C/decade) is virtually identical to the rate of warming during 2000-2014(0.116°C/decade).
Looking back at the full observation record (1880-present), the rate of warming with these corrections factored in is essentially the same as in NOAA’s previous analysis (0.068°C/decade and 0.065°C/decade, respectively). As stated by the NOAA team, “this reinforces the point that corrections mainly have an impact in recent decades.”

Comparison of global temperature trend between the old temperate dataset analysis and the new analysis. The reanalysis indicates little difference in the trend between the periods 1950-1999 and 2000-2014. Credit: NOAA (http://www.noaanews.noaa.gov/stories2015/noaa-analysis-journal-science-no-slowdown-in-global-warming-in-recent-years.html)
What does this all mean?
When an update to a widely used dataset is made, you can expect differing scientific opinions and the latest NOAA research is no exception. Some researchers, like Gavin Schmidt from NASA and Stefan Rahmstorf from the Potsdam Institute for Climate Impacts Research, express some level of vindication, having considered the “hiatus” to be a misnomer in the first place. Others, like Gerald Meehl from the National Center for Atmospheric Research, feel that a “hiatus” can still be identified, it is just sensitive to the dates chosen to measure the trends.
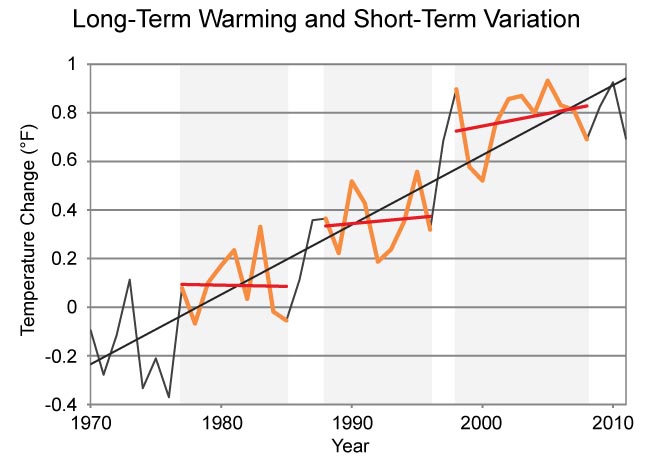
The global temperature often exhibits short periods of little or no warming, embedded in a much longer warming trend. Understanding ways that the Earth system can move heat around (e.g., storing more heat in the ocean), or ways in which other natural factors affect global temperature (e.g., volcanic eruptions), can have a big impact on scientists’ estimates of warming for the next couple of years or couple of decades.
But zooming in on one day, year or decade misses the trend emerging over the last century – the concentration of greenhouse gases in the atmosphere and average global temperatures have been rising. As a result, sea level is higher and climate scientists tell us to expect increasingly more frequent heat waves and heavy rainfall events. That’s the big picture to keep in mind.