Publication
Leveraging Natural Gas to Reduce Greenhouse Gas Emissions
Recent technological advances have unleashed a boom in U.S. natural […]

Technological advances have greatly increased U.S. natural gas production, keeping prices historically low and spurring many electric utilities and industrial companies to switch from coal to natural gas. To a lesser extent, policies have also played a role in the shift to natural gas. Because burning natural gas yields fewer carbon dioxide emissions than burning coal, the transition to natural gas has accounted for much of the decrease in greenhouse gas emissions from the U.S. electric sector in recent years. Importantly, natural gas power plants have become far more efficient, producing more energy with less fuel, over the past 25 years. New natural gas combined cycle power plants emit less than one-third the amount of carbon dioxide of a coal-fired power plant with far fewer air pollutants and virtually no particulate matter. Renewable electricity policies have also contributed to emission reductions. As of 2024, natural gas is responsible for 43 percent of U.S. electricity generation, making it the largest electricity source in the country.
Natural gas can be leveraged to further reduce emissions by:
However, natural gas generation has its shortcomings. Natural gas combustion accounted for nearly one-half of carbon dioxide emissions from the U.S. power sector in 2024. Moreover, methane leaks from extraction and transportation of natural gas further exacerbate global climate change. Methane (the primary component of natural gas) has a global warming potential 21 times higher than carbon dioxide over a 100-year period, though methane persists in the atmosphere for much less time (around a dozen years) than carbon dioxide (many decades).
To fully realize the potential climate benefits of natural gas, technologies and policies are needed to:
Natural gas is a naturally occurring fossil fuel consisting primarily of methane. It may also contain heavier liquids (also known as natural gas liquids) that can be processed into valuable byproducts including ethane, propane, butane and pentane.
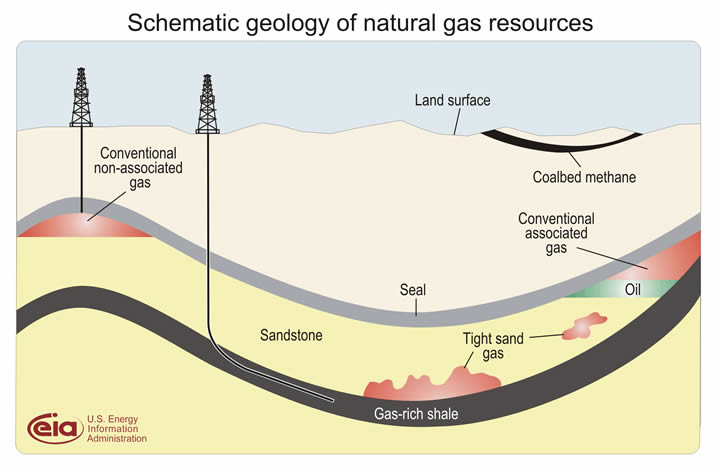
Historically, natural gas has been conventionally extracted from large reservoirs and often produced in conjunction with oil. In the 21st century, technological advances in horizontal drilling and hydraulic fracturing have made it easier and cheaper to obtain gas from smaller unconventional sources including non-porous sand (tight sands), coal seams (coal bed methane), and most recently from very fine-grained sedimentary rock called shale (shale gas). Concerns about the practice of hydraulic fracturing (colloquially known as “fracking”) include: stress on surface and ground water supplies, contamination of drinking and surface water, handling of discharges from fractured wells, land subsidence, and air pollution.
Natural gas is most often transported via pipeline. Where pipelines do not exist or for overseas transport, natural gas can be supercooled into “liquefied natural gas” (LNG). Some power plants also keep reserves of LNG to use in instances of high energy demand. In recent years, the U.S. has become a net exporter of LNG due to the expansion of domestic natural gas production, and in 2024 exported 4,367,170 million cubic feet of liquified natural gas. Natural gas can also be compressed into “compressed natural gas” (CNG). Both LNG and CNG are used for transportation, primarily medium- and heavy-duty vehicles such as public transportation buses.
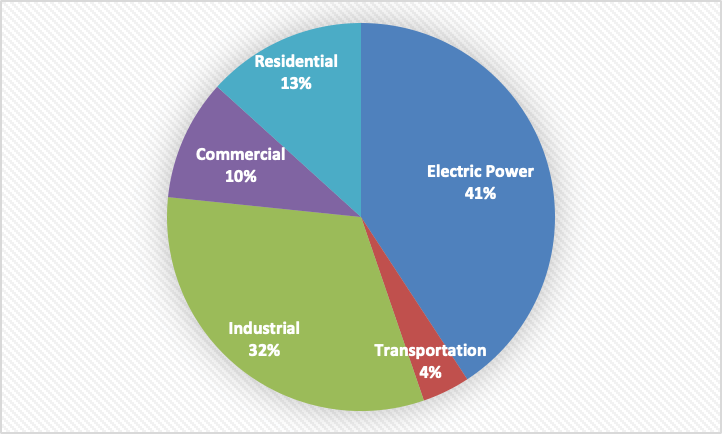
Constituting 36 percent of primary energy consumption, natural gas is used in every economic sector, including electric power generation, industry, residential and commercial buildings, and transportation.
With the rapid increase in supply, natural gas plays an increasing role in power generation. Natural gas now exceeds coal as the largest power generation fuel source at more than 43 percent of the U.S. electricity market.
Natural gas combined cycle (NGCC) power plants can provide baseload, intermediate, and peaking electric power, essentially able to meet all types of electrical demand. Natural gas is a relatively inexpensive, reliable, dispatchable source of power that can supply firm backup to intermittent sources such as wind and solar. Natural gas power plants can be constructed relatively quickly, in as little as 20 months, and tend to have projected lifetimes of 30 to 40 years.
Beyond the benefits of substituting natural gas for coal in a traditional, centralized power-generation system, emissions could also be reduced through distributed generation, making electricity at or near the site where it is used. A common example of distributed generation is solar panels on home or office rooftops, but natural gas-powered combined heat and power (CHP) systems (which efficiently use the heat generated from electricity production for water and other heating needs) and fuel cells are becoming more common in industrial, commercial, and residential settings.
In order to achieve mid-century net-zero climate goals, natural gas plants (new and existing) will need to employ carbon capture, utilization, and storage capabilities (or corresponding sequestration-based offsets) before 2050. Additionally, natural gas power plants could be converted to run on low carbon fuels like clean hydrogen or ammonia.
Natural gas provides almost a third of the energy used by U.S. industry. It is used for on-site electricity generation (fueling boilers and turbines); for process heat to melt glass, process food, preheat metals, and dry various products; and for combined heat and power (CHP) systems. Natural gas is also used as a material input itself—as a feedstock—to make products such as fertilizers, chemicals, and plastics in processes that do not emit greenhouse gases.
Replacing lower-efficiency boilers and deploying CHP systems can reduce the emissions intensity of the industrial sector, even as natural gas continues to grow as a proportion of total fuel consumption in the sector. Moreover, new boilers can have a 95 percent efficiency rate, as compared to pre-1985 boilers that average 65 to 70 percent, or those that meet the 2004 standard of 77 to 82 percent. Upgrading these industrial boilers can yield substantial avoided carbon emissions in the sector.
Electricity use has been growing more rapidly in buildings due to the proliferation of electronic devices, while natural gas use has remained flat and generally confined to space heating, water heating, cooking, and clothes drying. However, natural gas appliances can often be more efficient on a full-fuel-cycle basis than similar appliances that use electricity, propane, or oil. The source-to-site efficiency of natural gas averages 92 percent; that is, 92 percent of the energy contained in extracted natural gas is useful energy that can directly fuel appliances, as compared to about 30 percent efficiency for electric appliances. However, continued reliance on natural gas appliances will not enable us to achieve our mid-century net zero emission goal. As the electric grid in the U.S. continues to decarbonize, greater use of electric appliances affords a cleaner pathway to decarbonizing buildings.
Natural gas may also increase the overall efficiency of consumer energy when used for electricity generation on site through fuel cells and microturbines. Natural gas-powered fuel cells use natural gas and air to create electricity and usable heat through an electrochemical process rather than combustion, meaning fuel cells are highly efficient compared to other forms of distributed generation and produce relatively low emissions. Fuel cell technology has been around for decades but has not been widely deployed due to concerns about cost and durability. Microturbines are small combustion turbines approximately the size of a refrigerator with individual unit outputs of up to 500 kilowatts (kW). They can be fueled by natural gas, hydrogen, propane, or diesel. Like fuel cells, microturbines can achieve much higher energy efficiencies, because the electricity and waste heat generated can be used on site.
Transportation now accounts for the greatest share of U.S. greenhouse gas emissions (about 28 percent of total emissions in 2018), and energy use in the sector is dominated by oil. The majority of natural-gas-fueled vehicles in the United States are buses and trucks running on compressed natural gas (CNG) or liquefied natural gas (LNG). CNG and LNG can reduce greenhouse gas emissions as compared to gasoline and diesel, and they are energy-dense fuels that can be used in heavy-duty engines where electrification may not yet be economically viable. Limited availability of fueling infrastructure is one of the hurdles to deploying more natural gas trucks.
Hydrogen gas has significant potential to contribute to decarbonization as a versatile zero-emission energy carrier across multiple sectors of the economy. The primary production pathway in the United States today is steam methane reforming (SMR) and autothermal reforming (ATR), which creates “gray” hydrogen from natural gas; it also creates significant carbon dioxide emissions. However, when carbon capture technology is applied to the reforming process, very low-emission or “blue” hydrogen is produced. Globally, less than one percent of SMR production is “blue” hydrogen, but if it were scaled up and largely replaced “gray” hydrogen production, it represents a clean energy pathway that utilizes natural gas and would be consistent with mid-century climate targets. Additionally, methane pyrolysis is another promising clean hydrogen production technology that uses natural gas as an input. Methane pyrolysis uses energy to crack methane into hydrogen and valuable solid carbon (e.g., carbon black, graphite, carbon nanotubes) with no carbon dioxide emissions. Its attractive features include modular, scalable production and its ability to be located near existing natural gas pipelines and the point of consumption (i.e., power plant, vehicle refueling station, fertilizer production facility), minimizing transportation costs.