Share

California Cap and Trade

At-a-glance

  • California’s carbon cap-and-trade program is one of the largest multi-sectoral emissions trading systems in the world.
  • The program is central to meeting California’s ambitious goals to reduce greenhouse gas emissions to 1990 levels by 2020 (which it met in 2016), 40 percent below 1990 levels by 2030, and 80 percent below 1990 levels by 2050. California also has additional goals of achieving 100 percent carbon-free electricity by 2045 and economy-wide carbon neutrality by 2045.
  • Revenues that California receives from the program are deposited into the state’s Greenhouse Gas Reduction Fund and then appropriated to state agencies to implement programs that further reduce greenhouse gas emissions. 35 percent of the revenues are required by law to be directed to environmentally disadvantaged and low-income communities. Since it commenced, the program has generated5 billion dollars of total revenue.
  • The program is linked with the Canadian province of Quebec’s cap-and-trade system through the Western Climate Initiative.
  • Statewide greenhouse gas emissions decreased 5.3 percent from the start of the program in 2013 to 2017. While it is difficult to establish causality between emissions reductions and any specific policy or market condition, at least some of this reduction can likely be attributed to California’s cap-and-trade program, which covers about 85 percent of the state’s emissions and invests billions of dollars in emission reducing projects.

Overview

California’s cap-and-trade program, launched in 2013, is among a suite of major policies the state is using to lower its greenhouse gas emissions. California’s emissions trading program is the fourth largest in the world, following the cap-and-trade programs of China, the European Union, and the Republic of Korea. In addition to driving emissions reductions in one of the world’s largest economies, California’s experience has provided valuable insights into creating and managing an economy-wide cap-and-trade system.

California’s system is a central component of the state’s broader strategy to reduce greenhouse gas emissions to 1990 levels by 2020, 40 percent below 1990 levels by 2030, and 80 percent below 1990 levels by 2050. The state also has additional goals of 100 percent carbon-free electricity by 2045 and economy-wide carbon neutrality by 2045.

The program’s covered entities include large electric power plants, large industrial plants, and fuel distributors (e.g., natural gas and petroleum). In total, about 450 businesses that are responsible for around 85 percent of California’s total greenhouse gas emissions must comply. California has also linked its system with the Canadian province of Quebec’s cap-and-trade program, meaning that businesses in one jurisdiction can use emission allowances (or offsets) issued by the other for compliance. This increases the number of businesses under the cap, which reduces compliance costs by creating more options for companies to reduce their emissions.

Statewide greenhouse gas emissions decreased 5.3 percent from the start of the program in 2013 to 2017 (see figure below). While it is difficult to establish causality between emissions reductions and any specific policy or market condition, at least some of this reduction can likely be attributed to California’s cap-and-trade program, which covers about 85 percent of the state’s emissions and invests billions of dollars in emission reducing projects.

California Greenhouse Gas Emissions by Sector in 2017

California Cap-and-Trade Details

Cap-and-trade systems are one of several market-based ways to reduce greenhouse gas and other emissions. California’s program represents the first multi-sector cap-and-trade program in North America. Building on lessons from the northeast Regional Greenhouse Gas Initiative (RGGI) and the European Union Emission Trading Scheme (EU ETS), the California program blends proven market elements with its own policy innovations.

The California Air Resources Board (CARB) implements and enforces the program. The cap-and-trade rules first applied to electric power plants and industrial plants that emit 25,000 tons of carbon dioxide equivalent per year or more. Starting in 2015, the program was extended to fuel distributors meeting the 25,000-metric ton threshold. The program’s overall greenhouse gas emission cap declined by three percent annually from 2015 through 2020 and is designed to decrease an additional five percent from 2021 through 2030. Emission allowances are distributed by a mix of free allocation and quarterly auctions. The portion of emissions covered by free allowances varies by industry and by how efficient each facility is relative to industry benchmarks. These policy elements and other relevant details of California’s cap-and-trade program are summarized in the table at the end of this page.

California’s greenhouse gas emission cap and business-as-usual (BAU) projections

Auction revenue

Although a significant number of emission allowances are freely allocated for transition assistance and to reduce emissions leakage in California’s program, the majority are sold at auction. Revenues from these auctions are deposited in the state’s Greenhouse Gas Reduction Fund. The California Legislature then appropriates these funds to state agencies to administer programs that further reduce emissions. The California Climate Investments 2020 Annual Report found that allowance auctions have generated $12.5 billion in revenues since the start of the program. The report also highlights that the projects implemented through 2019 are expected to reduce greenhouse gas emissions by 44.7 MMTCO2e over their lifetimes—the equivalent of taking over 10 million gasoline-powered vehicles off the road for a year.

A pair of 2012 laws established guidelines on how this annual revenue is disbursed. The two laws do not identify specific programs that would benefit from the revenue, but they provide a framework for how the state invests cap-and-trade revenue into local projects. The first law, AB 1532, requires that the auction revenue be spent for environmental purposes, with an emphasis on improving air quality. The second, SB 535, requires that at least 25 percent of the revenue be spent on programs that benefit disadvantaged communities, which tend to suffer disproportionately from air pollution. The California Environmental Protection Agency identifies disadvantaged communities for investment opportunities, while the state’s Department of Finance oversees the expenditures of this revenue to mitigate direct health impacts of climate change.

In 2016, AB 1150 amended the criteria for revenue use again. It requires at least 25 percent of revenue to go to investments “within and benefitting disadvantaged communities and at least an additional 10 percent for low-income households or communities,” totaling 35 percent of revenue required to go towards disadvantaged and low-income communities.

AB 398, which Gov. Jerry Brown signed on July 25, 2017, further clarifies the priorities for investments as:

  • Reducing air toxic and criteria air pollutants
  • Promoting low- and zero-carbon transportation
  • Sustainable agriculture
  • Healthy forests and urban greening
  • Reducing short-lived climate pollutants
  • Promoting climate adaptation and resilience
  • Supporting climate and clean energy research

More information about how the proceeds from California’s cap-and-trade program are used can be found here.

California’s Overall Climate Change Program

California’s cap-and-trade program is only one element of its broader climate change strategy, as authorized in the California Global Warming Solutions Act of 2006 (AB 32) and the 2016 extension bill SB 32. AB 32 sets a statewide carbon limit by 2020 while SB 32 sets a statewide limit by 2030. AB 32 seeks to slow climate change through a comprehensive program that reduces greenhouse gas emissions from virtually all sources statewide.

AB 32 and other state laws also require a variety of actions aimed at reducing the state’s impact on the climate including a renewables portfolio standard, a low carbon fuel standard, an advanced clean cars program, and a variety of land use and energy efficiency standards and incentives. California’s cap-and-trade program acts as a backstop to ensure its overall greenhouse gas target is met, regardless of the performance of these complementary measures. The figure below shows how CARB is planning to achieve the state’s 2030 emissions goal. The reductions delivered by the cap-and-trade program depend upon reductions delivered by complementary policies.

For more information on actions taken by CARB in response to AB 32, visit the AB 32 Scoping Plan page which has the latest information about how the state is achieving and planning to meet its greenhouse gas reduction goals.

Projected Cumulative Reductions by Measure (2021–2030)

California Cap-and-Trade Details

Issue Details and Discussion
Status of Regulation
Legal Status California Air Resources Board (CARB) adopted final regulations on October 20, 2011. The regulation has been amended periodically since then. The legislature authorized an extension of the program (AB 398) through 2030 in 2017. Pursuant to this extension, CARB amended the program regulation at the end of 2018 in order to address cost containment, offsets, allocation, phase-out of exemptions, administrative issues, and the delinking with Ontario.
Regulation Coverage
Threshold of Coverage Sources that emit at least 25,000 metric tons CO2e/year are subject to regulation, including importers of electricity to the state.
Gases Covered The six gases covered by the Kyoto Protocol (CO2, CH4, N2O, HFCs, PFCs, SF6),
plus NF3 and other fluorinated greenhouse gases
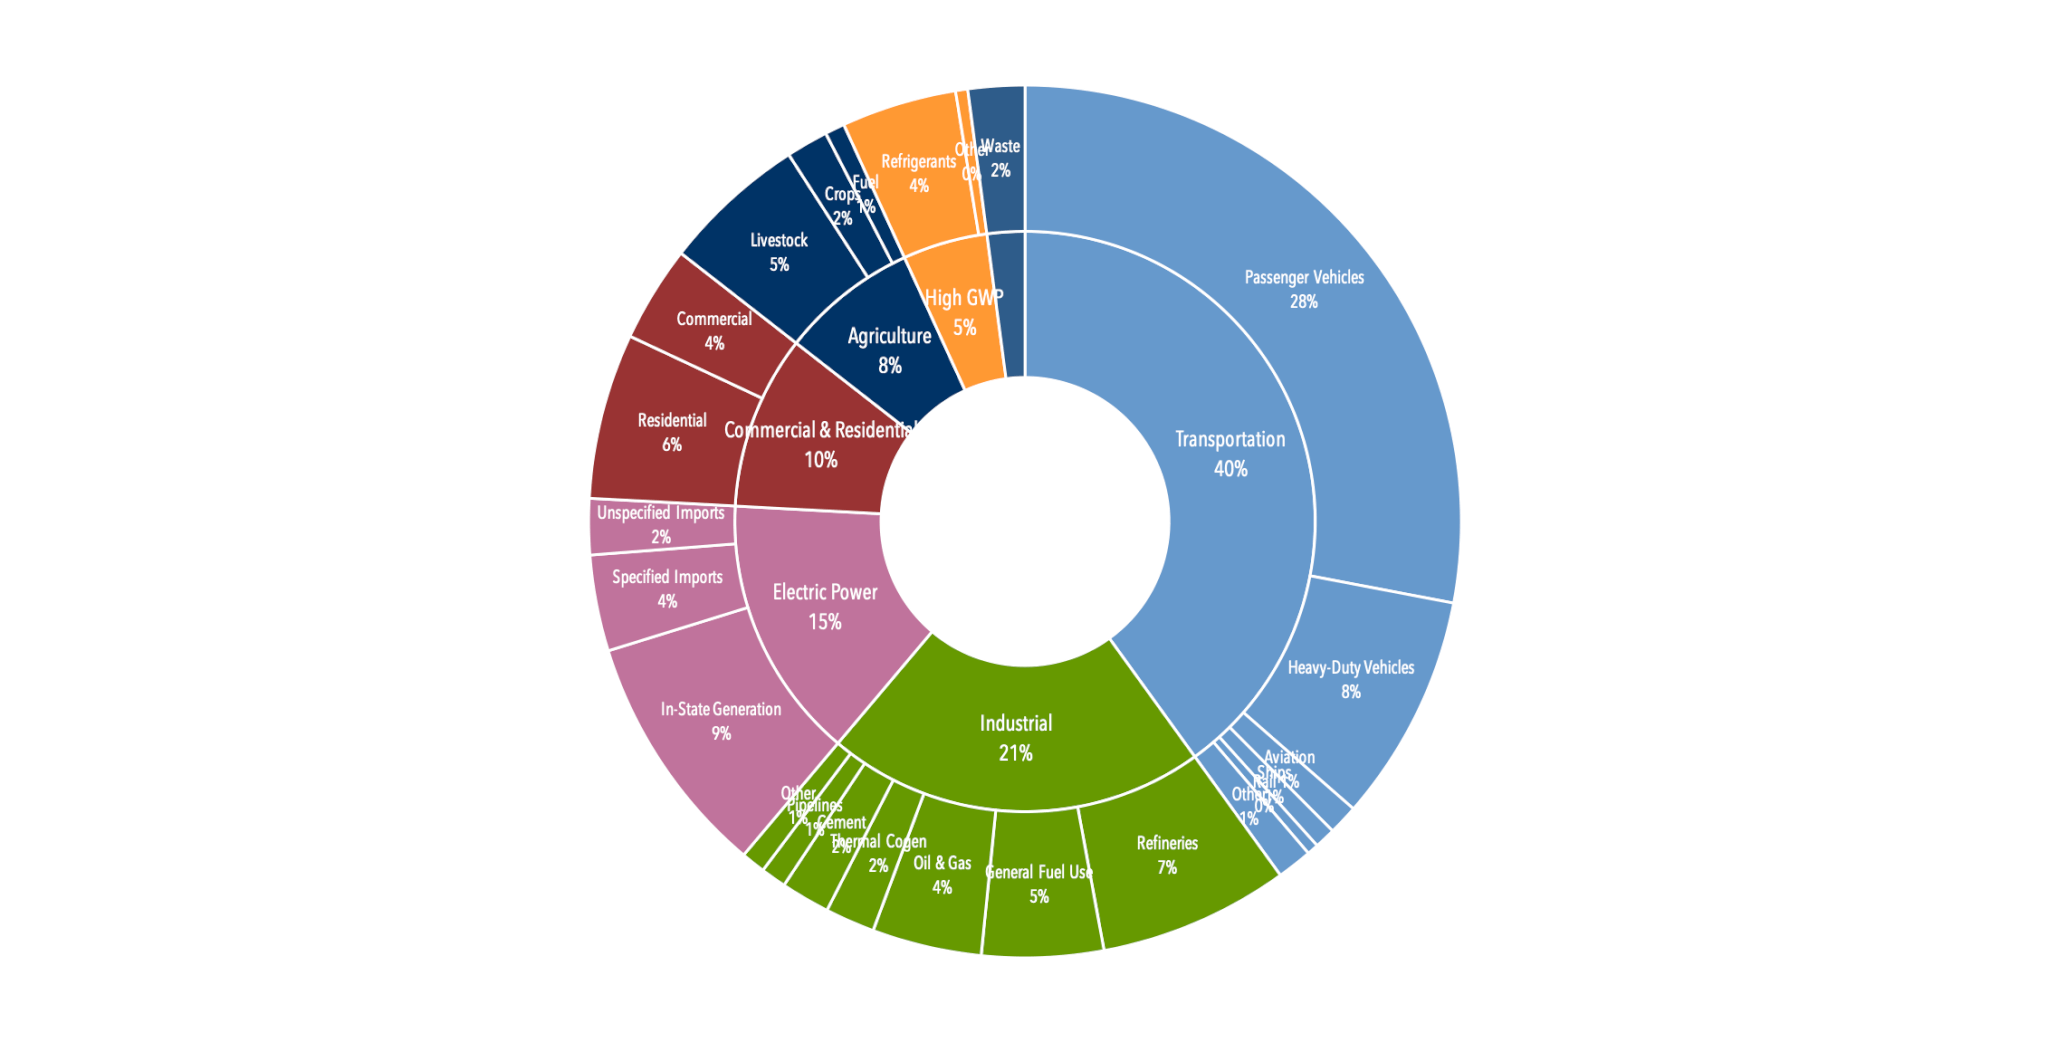
Sectors Covered: Phase 1 (2013-2014) Electricity generation, including imports
industrial sources
Sectors Covered: Phase 2 (2015-onward) Includes sectors covered in Phase 1, plus:
Distributors of petroleum
Distributors of natural gas
Point of Regulation Electricity generators (within California)
Electricity importers
Industrial facility operators
Fuel distributors
Allowance Allocation
Distribution Method Free allocation for electric utilities, industrial facilities and natural gas utilities (investor-owned utilities must sell free allowances and redistribute funds to customers)
Free allocation to utilities declines over time
Other allowances must be purchased at auction or via trade
Allocation Methodology Industry: Based on output and sector-specific emissions intensity benchmark that rewards more efficient facilities
Electricity: Based on long-term procurement plans
Natural gas: Based on 2011 sales
Auction Quarterly, single round, sealed bid, uniform price
Price minimum: Began at $10 in 2012 and increases 5% annually over inflation
Price maximum: Additional allowances are available for sale when prices reach an upper threshold, set at $40 in 2012, increasing 5% annually over inflation. Beginning in 2021, a hard price ceiling of $65 will be set, increasing 5% annually (adjusted for inflation), and an unlimited supply of allowances will be available at this price
Investor-owned utilities must consign their free allowances to be sold at auction; must use proceeds for ratepayer benefitAdditional information, including auction results, can be found here
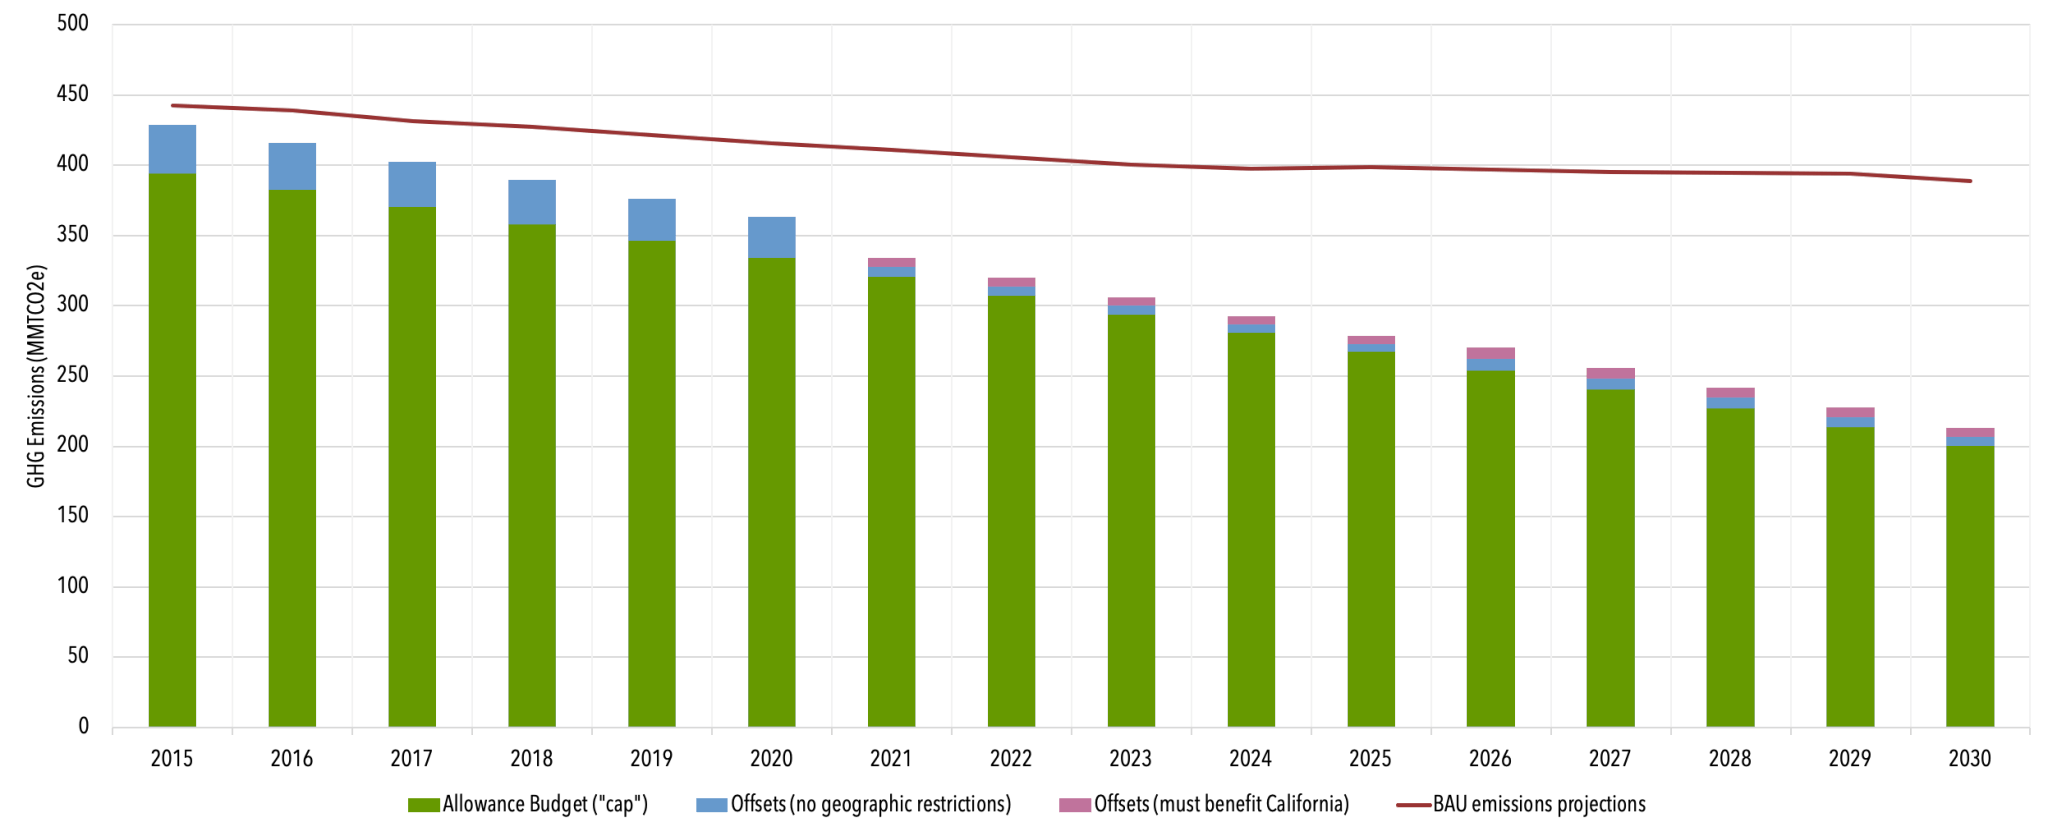
Emission Targets / Allowance Budget 162.8 MMT in 2013 (electricity and industry)
394.5 MMT in 2015 (includes all covered sectors)
334.2 MMT in 2020
200.5 MMT in 2030
(See Figure 2 below)
Compliance Flexibility
Banking A participating entity may bank allowances for future use and these allowances will not expire. However, regulated entities are subject to holding limits, restricting the maximum number of allowances that an entity may bank at any time. The holding limit quantity is based on a multiple of the entity’s annual allowance budget.
Borrowing Borrowing of allowances from future years is not allowed.
Offsets: Quantity Allowed for 8% of total compliance obligation through 2020; 4% between 2021 and 2025; 6% between 2026 and 2030. Beginning in 2021 at least half the offsets used for compliance must come from projects that directly benefit California.
Offsets: Protocols Offsets must comply with CARB-approved protocols. Protocols currently exist for: forestry (including urban forestry), dairy digesters, ozone depleting substances projects, mine methane capture, and rice cultivation. Offset projects may be located anywhere in the U.S. All offset projects developed under a CARB Compliance Offset Protocol must be listed with an ARB approved Offset Project Registry.
Strategic Reserve A percentage of allowances is held in a strategic reserve by CARB in three tiers with different prices: $62.29, $70.09, and $77.86 in 2020, rising 5% annually plus inflation. The strategic reserve will help constrain compliance costs by adding supply to the market when prices would otherwise be above the tiers.
Compliance Period 3-year compliance periods (following 2-year Phase 1), with a partial surrender obligation due each year.
Emissions Reporting and Verification
Reporting Covered entities must report annually (as required since 2008).
Registration Covered entities and other participants must register with CARB to participate in allowance auctions.
Verification Reported emissions must be verified by a third party.
Compliance and Enforcement
Annual Obligation Entities must provide allowances and/or offsets for 30% of their previous year’s emissions each year.
Compliance Period Obligation At the end of every multi-year compliance period, entities must provide allowances and/or offsets for the balance of emissions from the entire compliance period.
Noncompliance If a deadline is missed or there is a shortfall, four allowances must be surrendered for every metric ton not covered in time.
Trading and Enforcement The regulation expressly prohibits any trading involving a manipulative device, a corner of or an attempt to corner the market, fraud, attempted fraud, or false or inaccurate reports.
Violations of the regulations can result in civil or criminal penalties. Perjury statutes apply.
The program includes mechanisms to monitor for and prevent market manipulation.
Linking
Direct linkages California’s program linked with Quebec’s program on January 1, 2014, and Ontario’s program on January 1, 2018, but unlinked with the latter following Ontario’s discontinuation of its program in mid-2018. Offsets and allowances can be traded across jurisdictions. The linked jurisdictions hold joint auctions together.
Indirect linkages California has a memorandum of understanding with the Mexican state of Chiapas and the Brazilian state of Acre to develop sector-based offsets from projects that reduce emissions from deforestation and land degradation (REDD). A working group submitted recommendations for REDD protocols, though no REDD compliance protocols have been approved by CARB.

Washington state’s Climate Commitment Act could accept allowances from out-of-state programs for a facility’s compliance obligation. Washington’s Department of Ecology will begin a rulemaking process for the Climate Commitment Act. The rulemaking process could identify which carbon market(s)’s allowances would be eligible, and California is one possibility. If out-of-state buyers entered the market for California allowances, it could affect prices for California entities through an indirect linkage.